
Using cloud-native tools for Data and Analytics needs enables us to grow with our company and serve always new business units and new use cases. While having this flexibility and easy scaling was a key part in making La Redoute a data-driven company, cloud services and especially self-service analytics tools can quickly go out of hand by generating difficult-to-track and control costs.
So how do we use our data analytic tools to keep track and help control the explosion of costs that may occur when a company is scaling up its data needs and usages?
I – What Google Cloud Platform (GCP) tools do we use for our business analytic processes, and how do we use them?
First things first, a word about our Data Analytics stack, and the related costs that we are trying to optimize.
We use Google BigQuery, the serverless and highly scalable data warehouse tool offered by Google Cloud Platform, to process and deliver insights at scale to all business units within the company.
We use it to build data marts, business-ready tables, and datasets delivering all the insights that advanced business users will be able to use directly from BigQuery, using simple SQL queries to answer their questions.
We also use PowerBI to deliver dashboards, showing KPIs and daily reports on given business perimeters, either created within the Data team or by experienced business users. These PowerBI are plugged into BigQuery, either with schedules or in direct-query mode.
II – How it went – slightly – wrong and what do we want to achieve?
Over time, the global usage of data grew significantly within the company, with business users being keen on always getting more data and dashboards. As a result, we noticed that our Analytics Cost started to explode. It makes sense because we collect, clean, and transform a significantly larger amount of data year after year. But also, because our analytical users – either from the team or from a business unit – grew in number.
The self-service aspect made it hard to have clear governance or visibility over who was doing what and why. While this situation remained bearable, it was clear that it was not sustainable in the long term, and that actions needed to be taken.
Of course, our main requirement is to keep serving as many business needs as possible, as we are above all here to support the business. Yet, we need to find a way to keep an eye on existing reports and monitor their cost, be able to choose our fights as to which legacy analytics pipeline/report should be refactored, and detect new queries/users that might need some education on our best practices.
III – The 3 steps process to regain control over our costs
Now that the objective was clear, here is the 3 steps process that we used to solve our cost and visibility limitations.
A – Data Collection: Audit logs, sinks to GBQ
GCP natively creates tons of logs, including logs about the queries that users – or service accounts – run against our BigQuery tables.
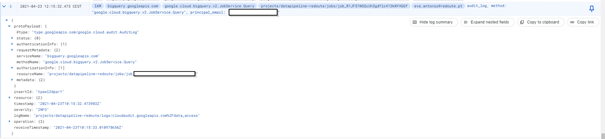
But reading and acting directly upon these logs is not user-friendly. So we defined an export of these logs, filtering on Bigquery logs only, with a destination dataset in BigQuery that we created for the occasion. Once this export/sink is in place, all new queries and related information – who sent the query, how much did it cost… – was send directly by GCP to our BigQuery dataset.- Note: we cannot export the older logs that are in Cloud Logging, this feature is not available yet on GCP.
Once the data was in BigQuery, we were on familiar grounds, where we can use SQL to explore this data, group the logs from various projects, and start getting the first results, by ordering by queryBilledSize for instance.
B – Data exploitation: summary in PowerBI, top requests, identifying patterns
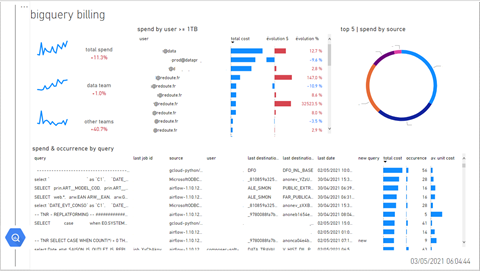
Now that we add all the data in BigQuery, we moved to PowerBI to help us visualize and get more insights from our data. The key questions that we answered were:
· What is the evolution of our costs week over a week?
· What are the most expensive queries, considering the average recurrent cost of the query over a week – an inexpensive query that runs every 2 minutes might end up costing more than a pretty expense query that runs once a week?
· Cost breakdown, by the user, by teams within the organization, by query interface (UI, Data Scheduling Tools, PowerBI, IT Tools, …)
C – Acting on these insights
Leveraging the various levels of granularity that we produced within our PowerBI, we were able to quickly identify the technical solutions that we needed to apply to solve the growing costs of certain pipelines. We set to optimize a few of our higher costs legacy pipelines, by redefining partitioning, filtering in the queries, and even rethinking the overall pipeline when it was needed.
Collecting these logs also provided us a better overview of the usage of our datasets/tables, and it allowed us to unplug legacy pipelines that were no longer used by our business users. We also now use these logs in our impact analysis when a data source is updated, giving us more visibility on who is using this data within the company.
Overall, it also helped our team and the business users realize that costs are indeed a crucial component when designing a solution, and establish guidelines about cost estimation and cost control.
This work has been led by Guillaumes Paques, Pierre Emmanuel Tonnerre, and Louis Morin.