In La Redoute we are working with Jenkins as our CI / CD tool and we already have a delivery dashboard in place.

However, we are starting to move to GitLab as our source code control and pipeline definition. So, in this article, we will go over the steps to create a deployment dashboard. As a result, we will incorporate information from both CI / CD tools.
Ingredients
The list may vary depending on the recipe. For this one in particular, here is the list of ingredients we will use:
Job events
This one is the main ingredient. We will need as many as we can get from each pipeline job event on our existing CI / CD tools.
For this dashboard, we will only use deployment events. However, this doesn’t mean that the remaining events (builds, packaging, testing, …) are not important. All job events should be collected and made available so that they can be used for different purposes. For instance, a Delivery dashboard.
3 Kafka Topics
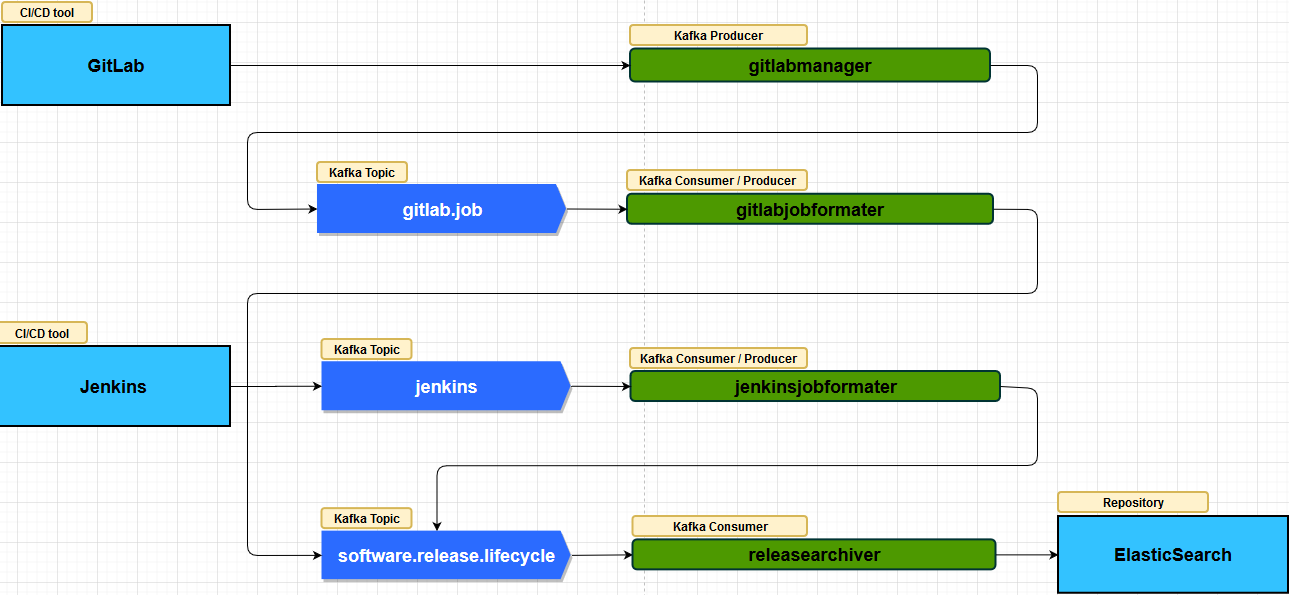
Since we we are using 2 CI / CD tools, we will use 1 topic to hold the Jenkins job events (and call it jenkins.job) and another for GitLab (let’s call it gitlab.job). These 2 topics will contain the job event information with no format change. This means that the message you get is the message you produce.
We will use a 3rd topic (let’s call this one software.release.lifecycle), to merge the events from both tools. In this case, the events will be in a standard format, regardless of their origin.
1 Jenkins Script
Script that we already have running in Jenkins and producing the events to the jenkins.job kafka topic. This was the solution we have implemented a while back and it is working until today. We could have used a different approach here, but we have opted to continue with the script.
1 Standard Event Format
We need to create a standard format so that the events from the existing CI / CD tools can be put together. This means taking common information and placing it under the same names. For example:
– type of job (build, testing, deployment, …)
– component
– job result
– when the job started
– the amount of time it took
– who triggered the job
– commit change that triggered the job
4 Microservices
The 1st microservice will handle the job events from GitLab (lets call it gitlabjobmanager). This component receives the information through a post method and produces a message to the gitlab.job kafka topic. Like we said before, no transformation is done to the message, besides the addition of an header with mandatory information for La Redoute events.
The 2nd microservice will consume the events from the gitlab.job kafka topic, format the event into the standard format and produce the result into the software.release.lifecycle kafka topic (we will call this one gitlabjobformatter).
The 3rd microservice will consume the events from the jenkins kafka topic. It will format the event into the same standard format, used for GitLab events, and produce the result into the same software.release.lifecycle kafka topic (lets call it jenkinsjobformatter).
The 4rd microservice will consume the events from software.release.lifecycle kafka topic (lets call this one releasearchiver) and add them to our next ingredient:
1 ElasticSearch Index
The index on ElasticSearch will hold the job events formated information and will be the source for our delivery dashboard.
1 Grafana
Grafana is where we create our delivery dashboard. This includes the need to have an available datasource to the ElasticSearch index contaning the information we want to use.
Preparation
We already have all ingredients on the table. The Jenkins events are being provided to jenkins.job kafka topic. All of our 4 microservices are in place and our ElasticSearch index is ready. Finally, we have Grafana ready for our delivery dashboard creation:
1) Add GitLab Webhook
First, we need to connect GitLab to our 1st microservice, gitlabjobmanager.
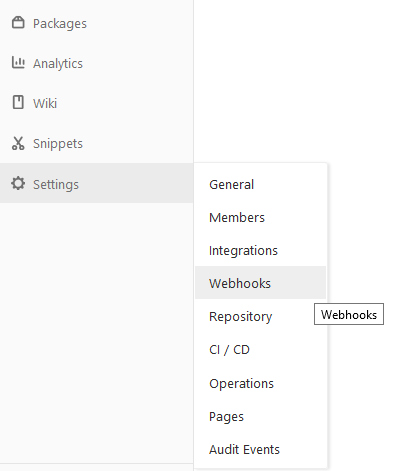
- Open GitLab and navigate to a project. Choose Webhooks from the Settings menu option:
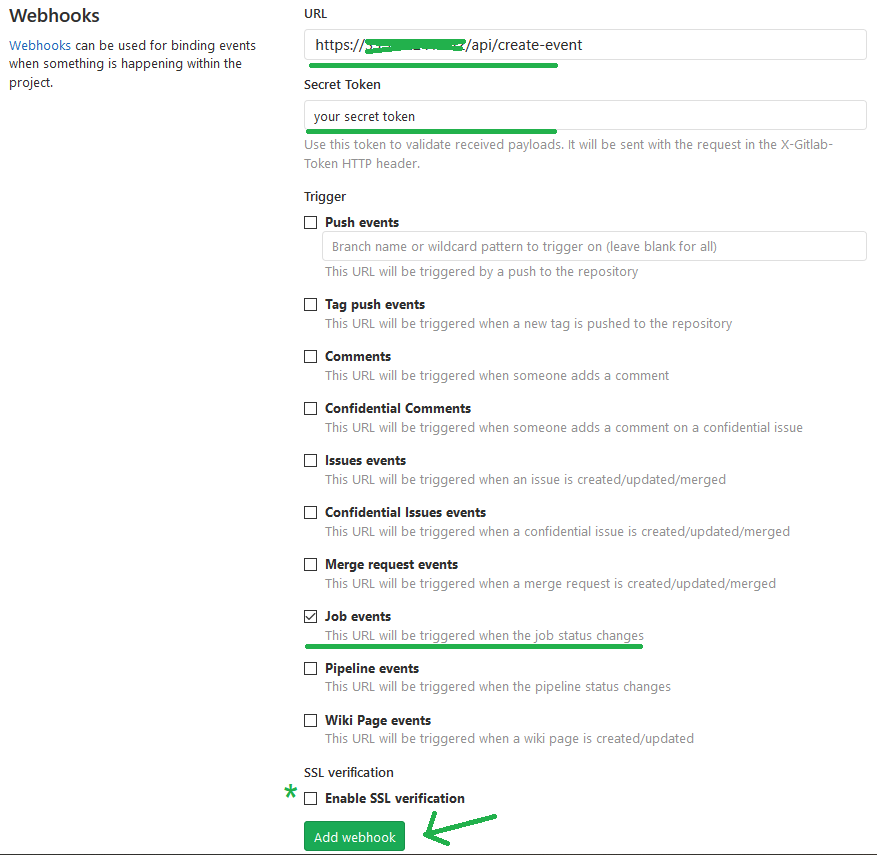
- Setting up the webhook:
- Set gitlabjobmanager microservice URL, including the post method
- A a secret token can be specified so the service can validate the message origin
- Choose the type of trigger for the events to receive. In this case, Job events
- Specify if SSL verification should be used or not
- Add Webhook
-
- Test webhook by going to the bottom of the page. Click on “Test” dropdown and select the type of event you want to test

Figure 5: Webhook successfully added
- Test webhook by going to the bottom of the page. Click on “Test” dropdown and select the type of event you want to test
Note: Make sure your service is accessible outside of your internal network. Otherwise, it won’t be possible to use it on GitLab
Important: It is also possible to add webhook at the group level, which is what we’ve done. The webhook is added the same way as for a project.
2) Check job events collection
Make sure the GitLab job events information are getting to the gitlab.job kafka topic when a pipeline is triggered on each CI / CD tool. At this point, we know that the events from Jenkins should already be available.
Once the job events are being received, confirm that the messages format arriving on software.release.lifecycle kafka topic is the one you expect and you are able to distinguish from which CI / CD tool the event was sent.
Finally, verify that the formatted job events are being replicated to the ElasticSearch index.
3) Create the delivery dashboard
Presentation is very important! So all we need now is to carefully plate the information!
We will do that by creating a dashboard on Grafana. This is just a simple presentation example, but you can get fancier!
Note that you will need an ElasticSearch datasource defined in Grafana so you can get the information on your dashboard.
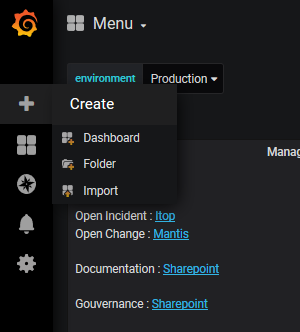
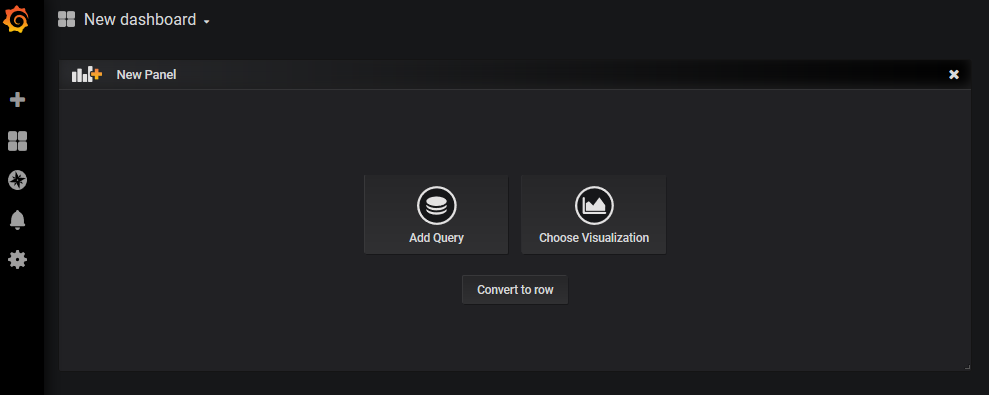
- Open Grafana and add a new dashboard
- On an empty dashboard, you get a new panel where you can choose convert to row
-
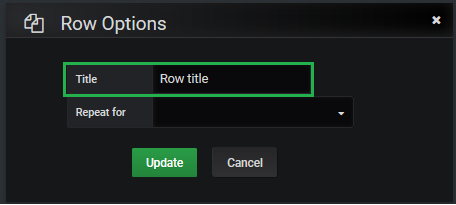
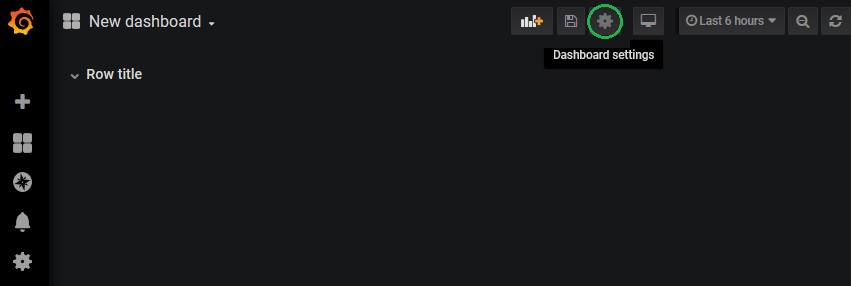
- The row will hold the panels you are going to create later. You can change its name by moving the mouse over the row and clicking on the settings icon:

-
- Change the Title as needed
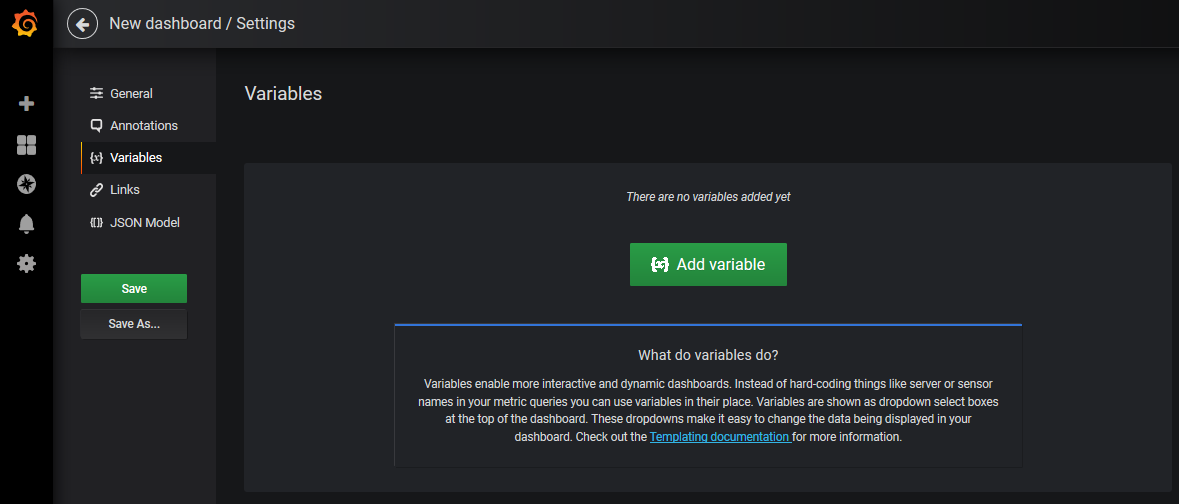
- Go to the dashboard settings
- Add the variables you need for the dashboard.
-
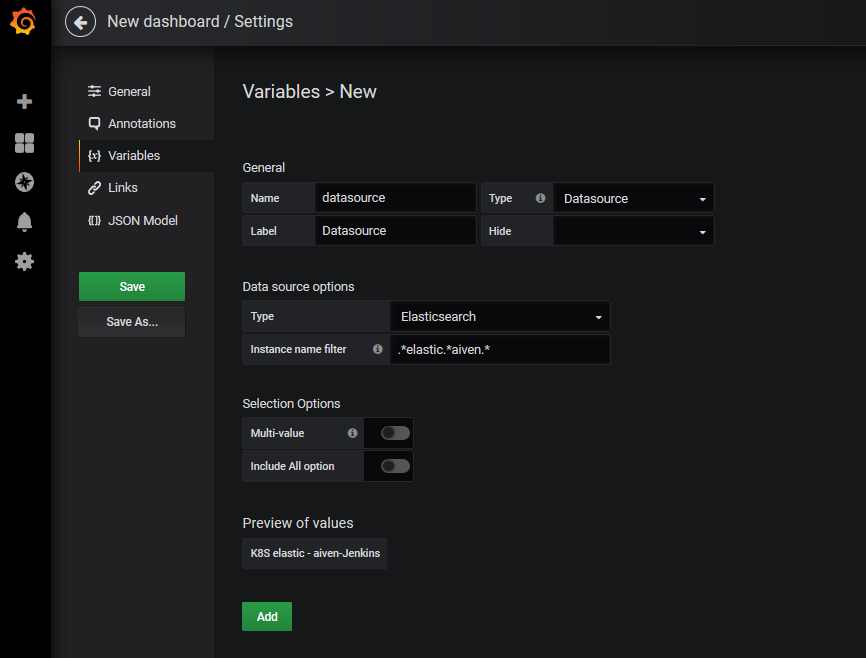
- Datasource
- Depending on the number of panels you are going to add, it is good to define a datasource variable that all panels can use. This way, if you need to change the datasource, you will not need to change it panel by panel, but only on the variable.
- Datasource
-
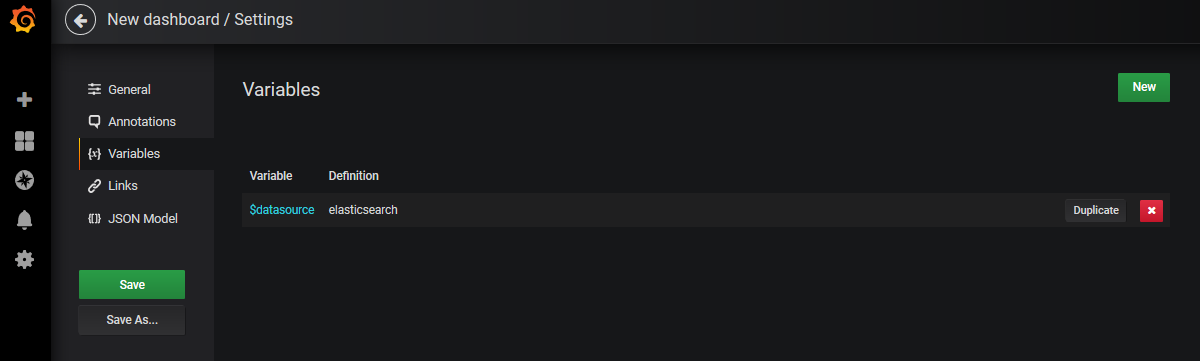
- Others variables
- Click on New
- Others variables
-
-
- For example, Environment:
-
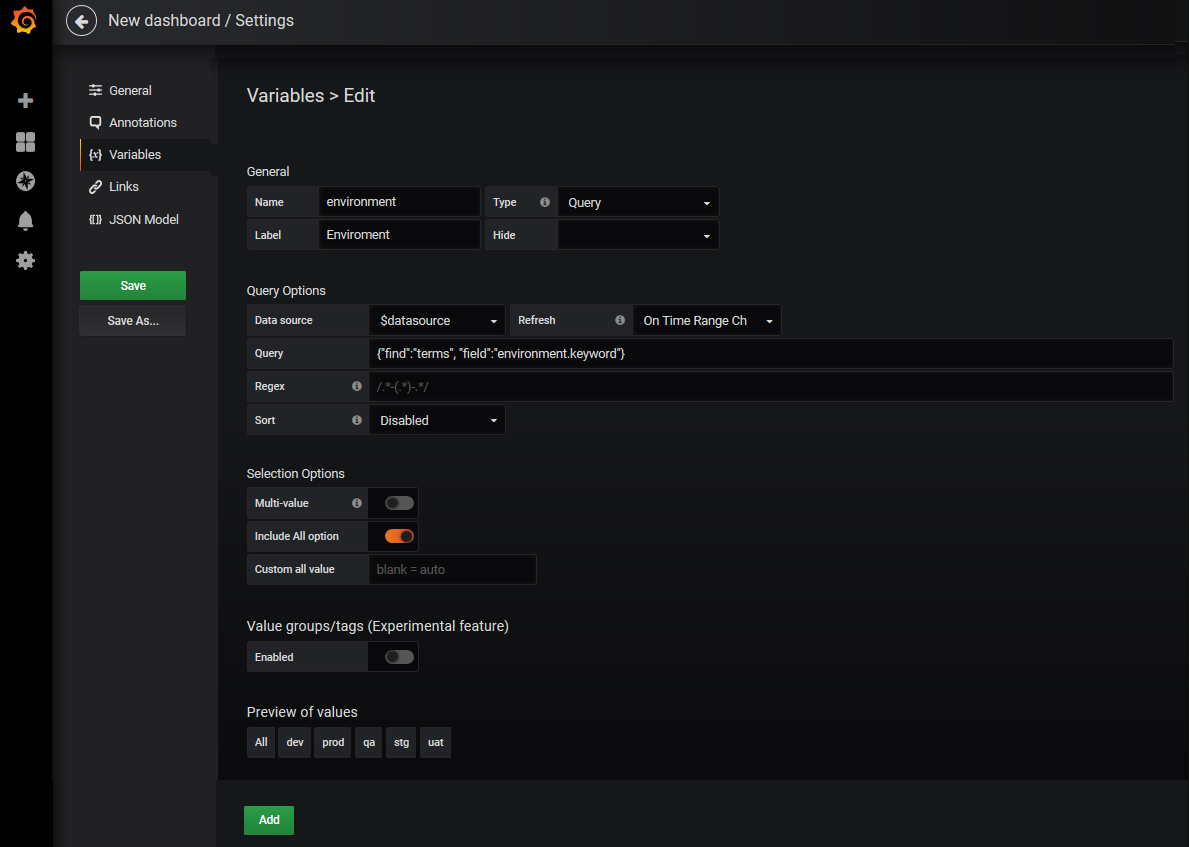
-
-
- You can add other variables, like a component filter
-
- Add new panel
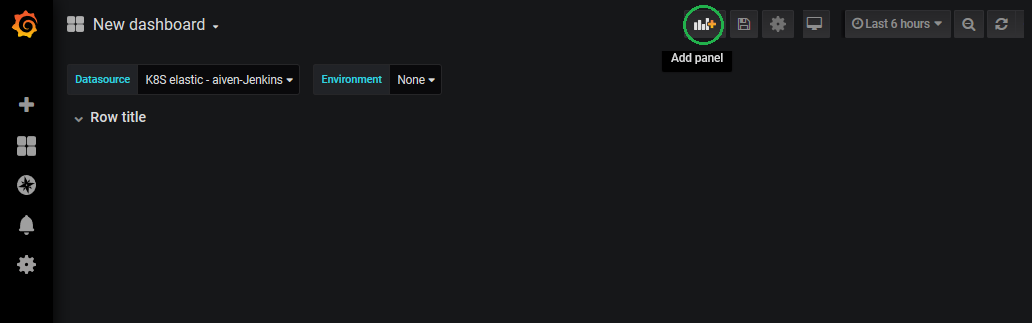
-
- Choose Visualization
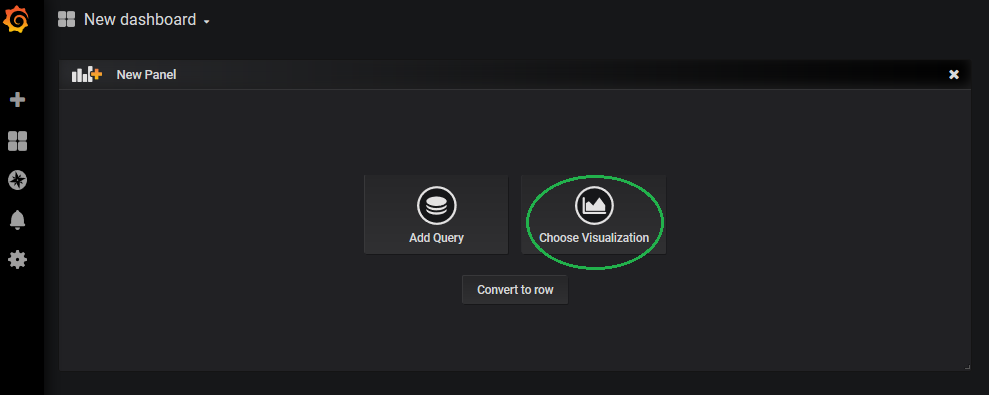
Figure 16: Choosing visualization
- Choose Visualization
-
- Choose Graph
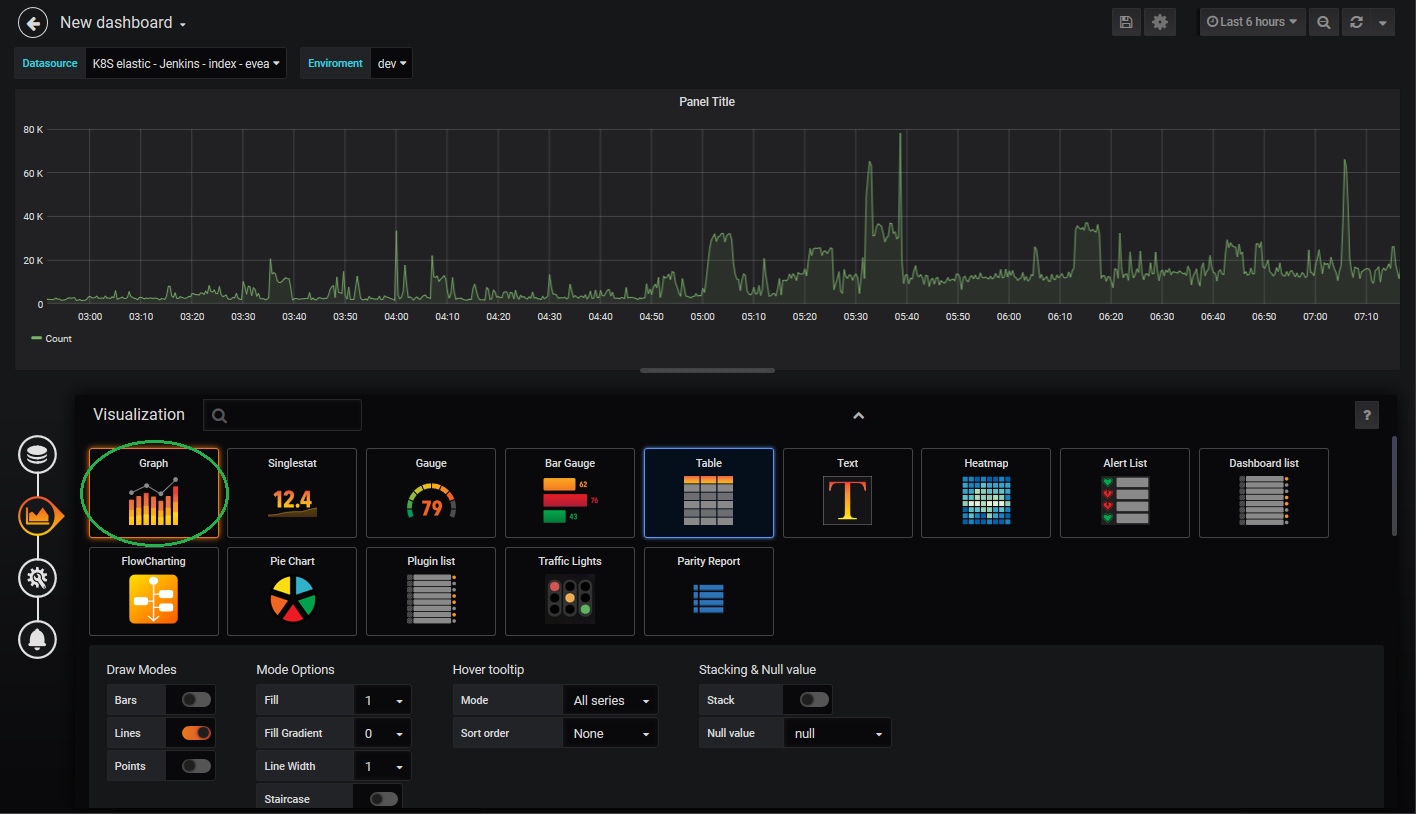
Figure 17: Adding a graph
- Choose Graph
-
- Go to the Query tab
- Specify your datasource variable and enter query. For example, filtering by environment
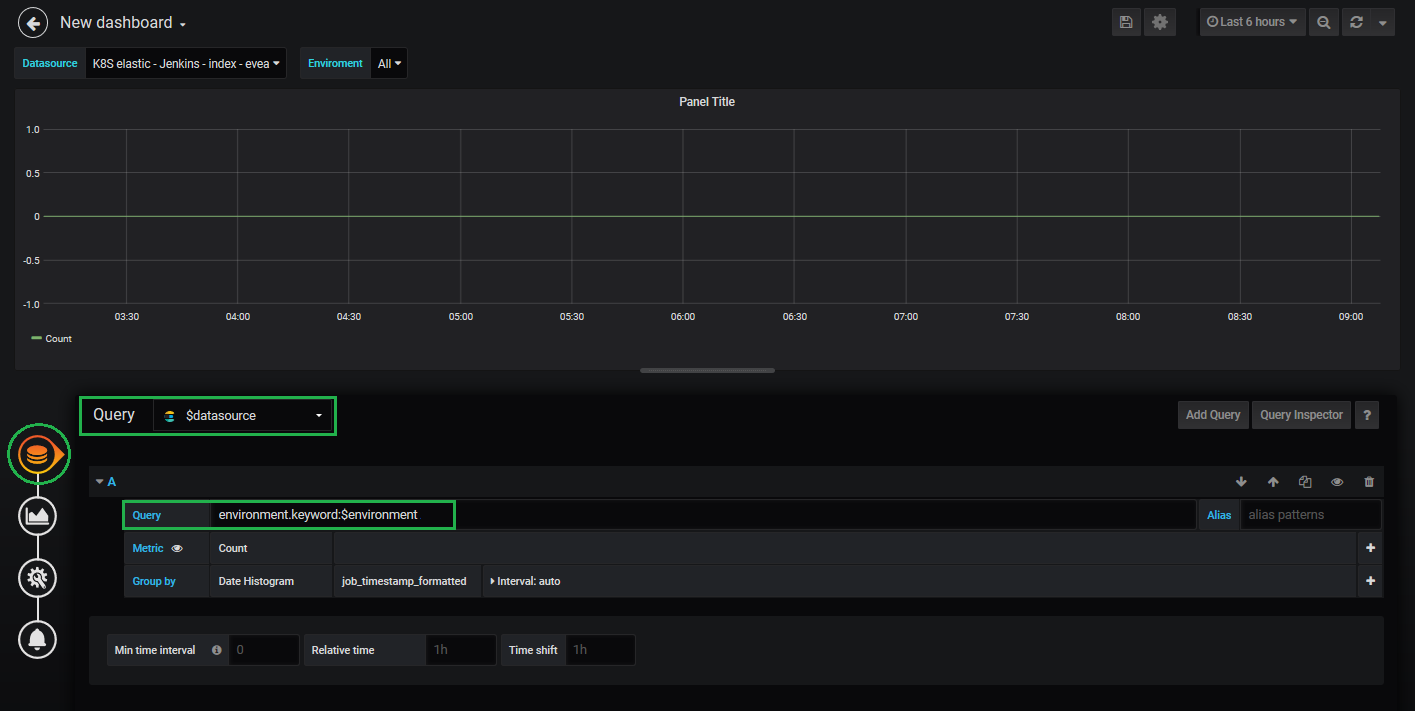
Figure 18: Adding a query to the graph
- Specify your datasource variable and enter query. For example, filtering by environment
- Go to the Query tab
-
- Go to the General tab and specify the title and Description as needed
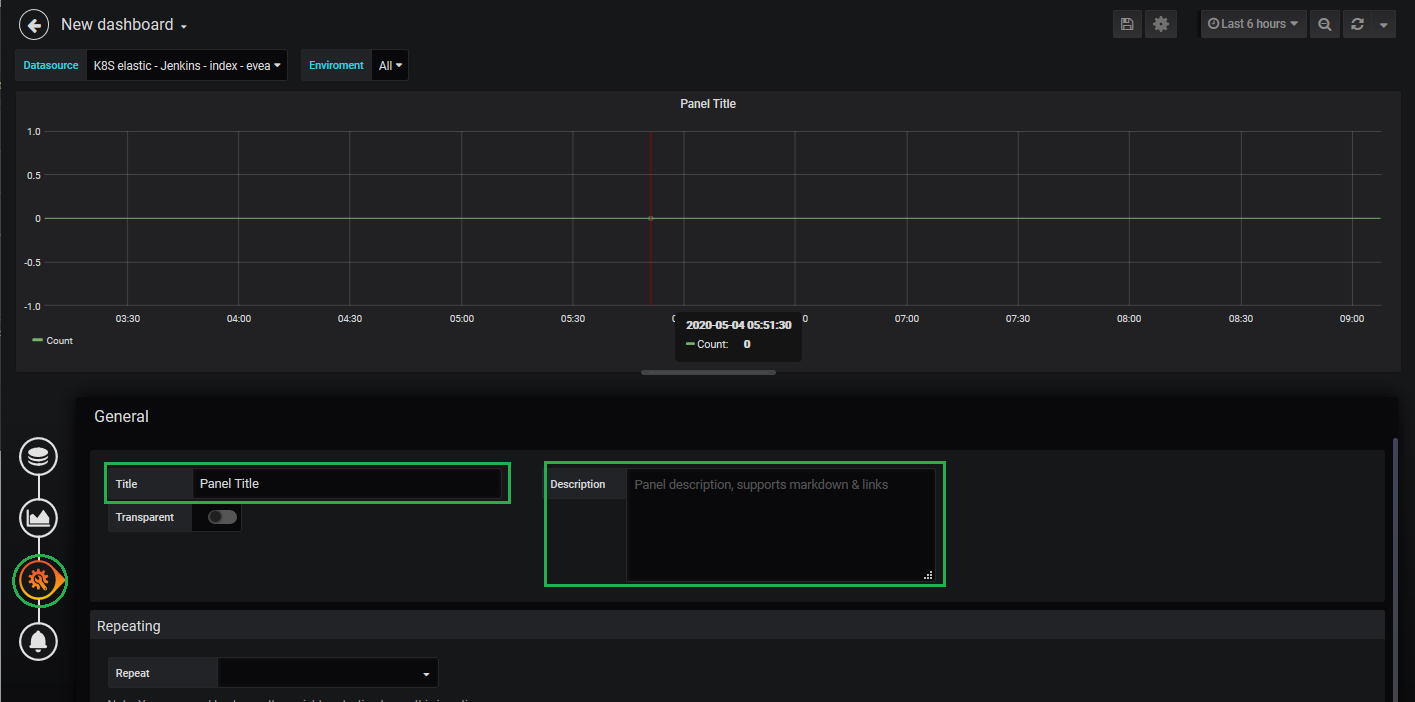
Figure 19: Graph settings
- Go to the General tab and specify the title and Description as needed
-
- Move panel to row and adjust size of the panel as needed
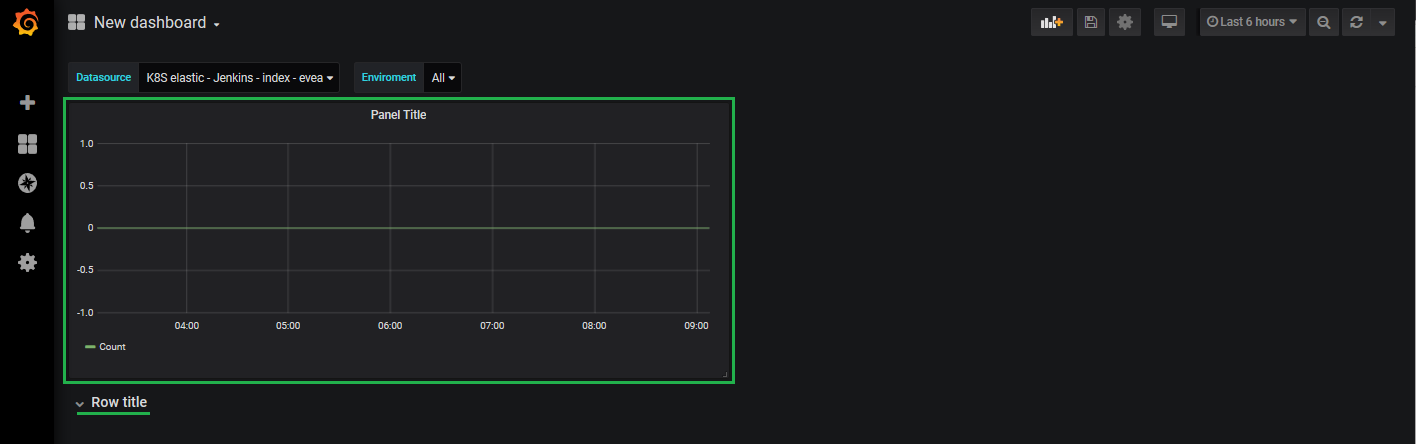
Figure 20: Moving the graph
- Move panel to row and adjust size of the panel as needed
- Add new panel
Figure 21: Adding new panel -
- Choose Visualization
Figure 22: Choosing visualization
- Choose Visualization
-
- Choose Table
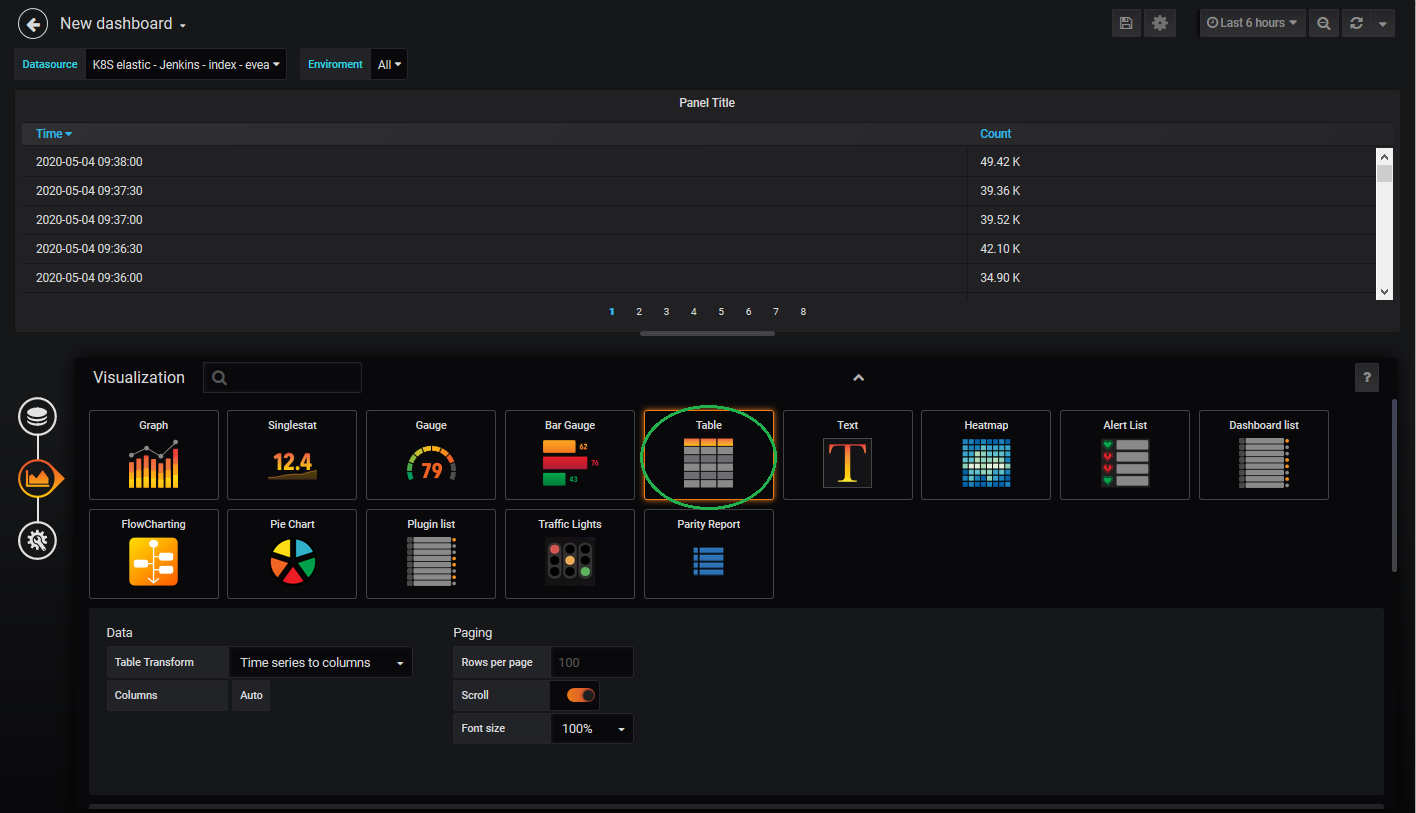
Figure 23: Adding a table
- Choose Table
-
- Specify your datasource variable and enter query. You should set the same query you’ve used for the Graph.
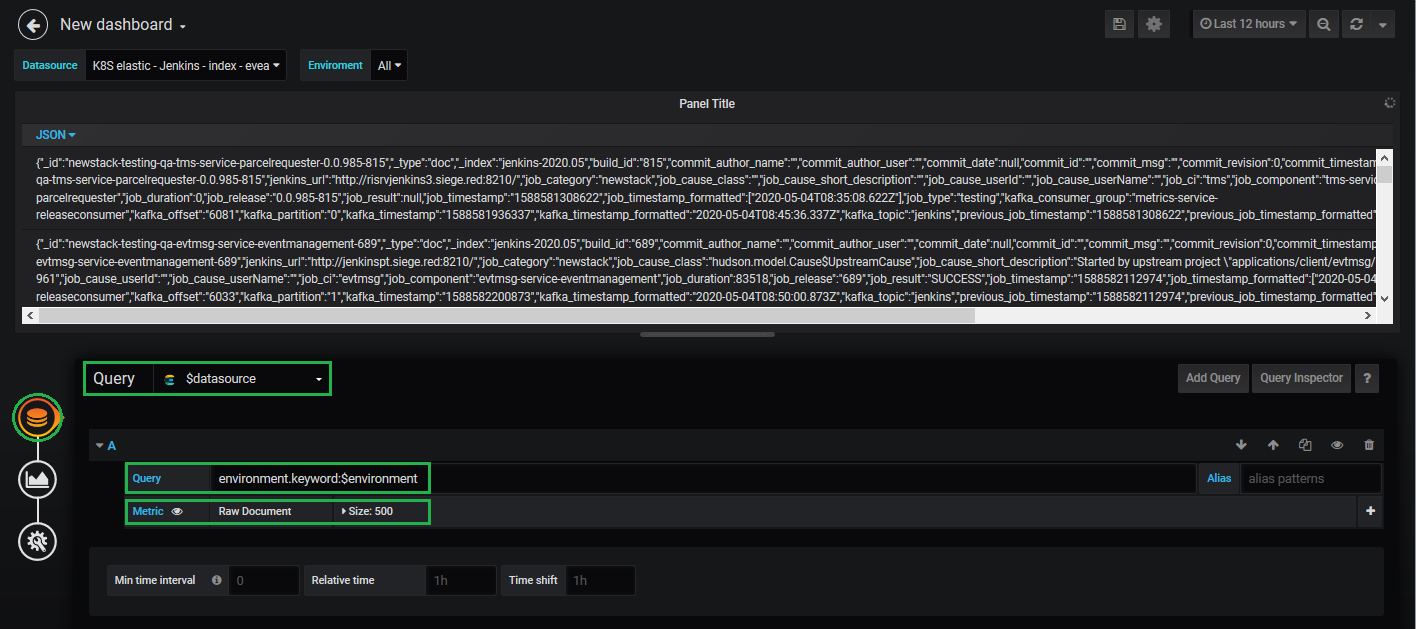
Figure 24: Adding a query to the table
- Specify your datasource variable and enter query. You should set the same query you’ve used for the Graph.
-
- Go to the Visualization tab and click on the + button to add the columns you want to display. You can change the columns style according to the information being displayed.
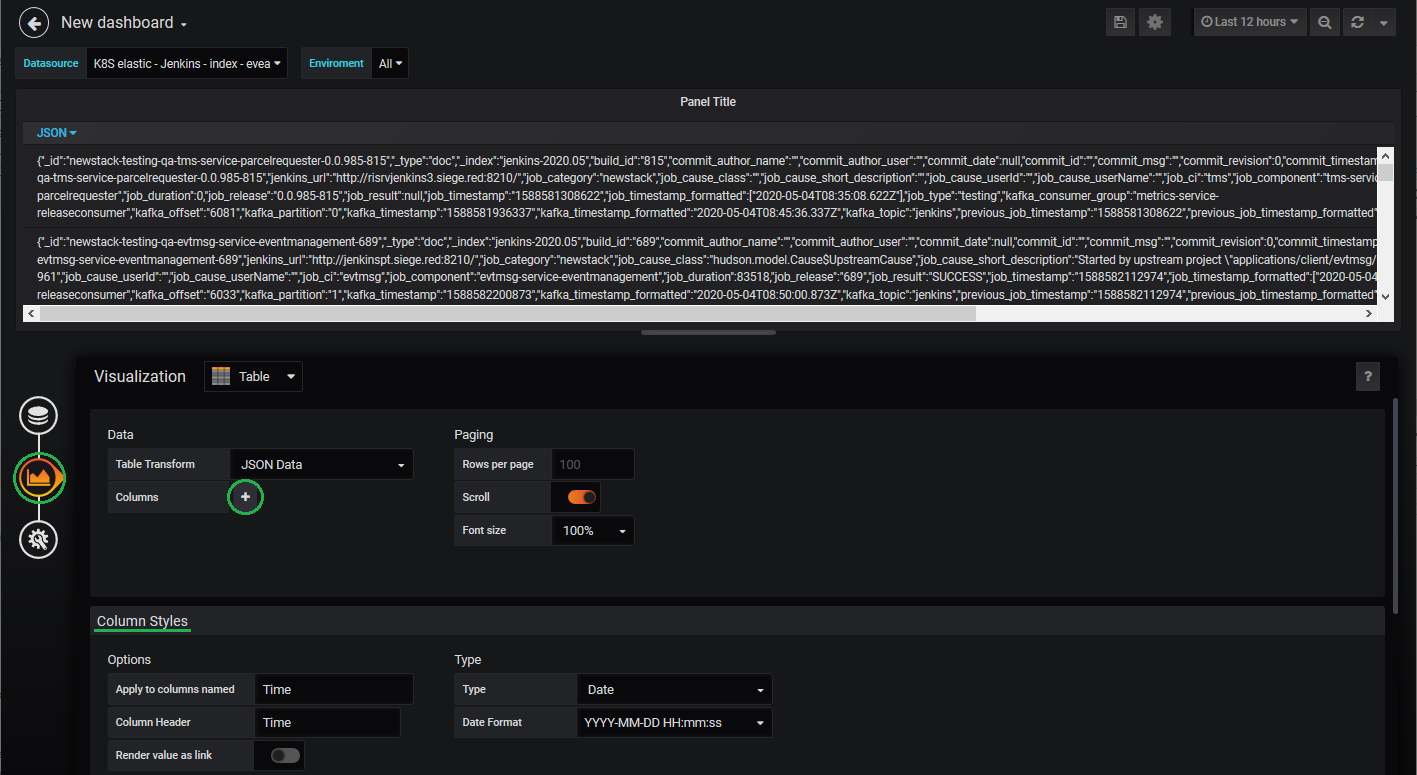
Figure 25: Adding columns to the table
- Go to the Visualization tab and click on the + button to add the columns you want to display. You can change the columns style according to the information being displayed.
-
- As before, you can go to the General tab and specify a title and description
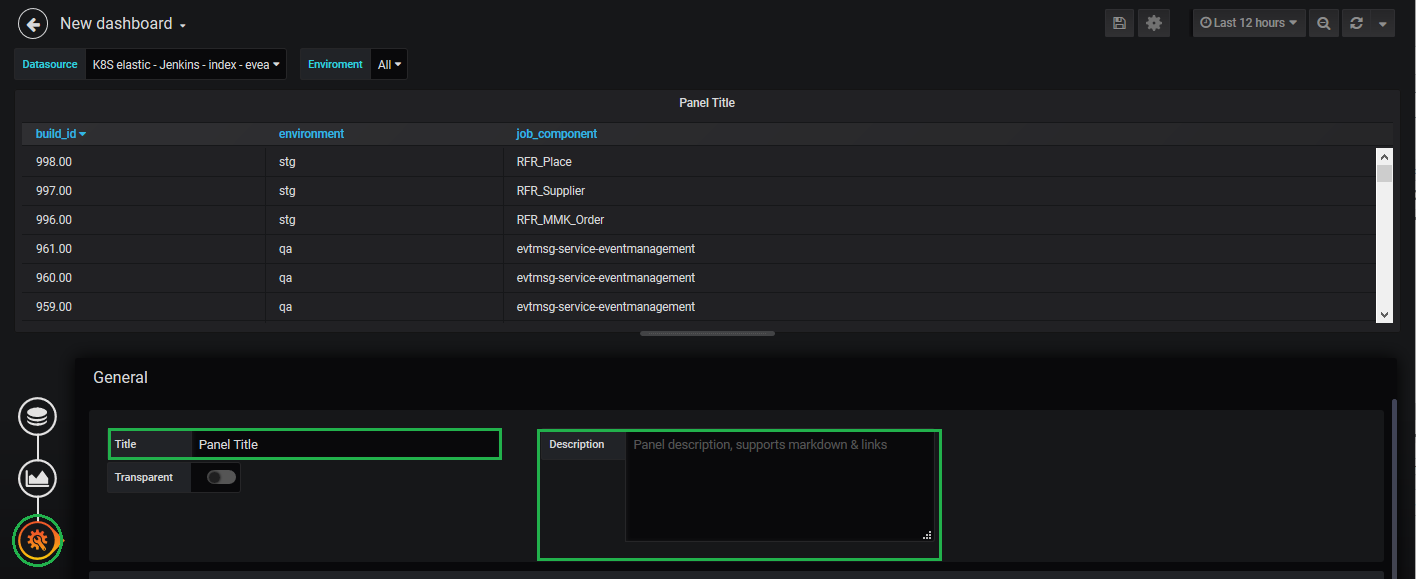
Figure 26: Table settings
- As before, you can go to the General tab and specify a title and description
- Move panel to row and adjust size of the panel as needed
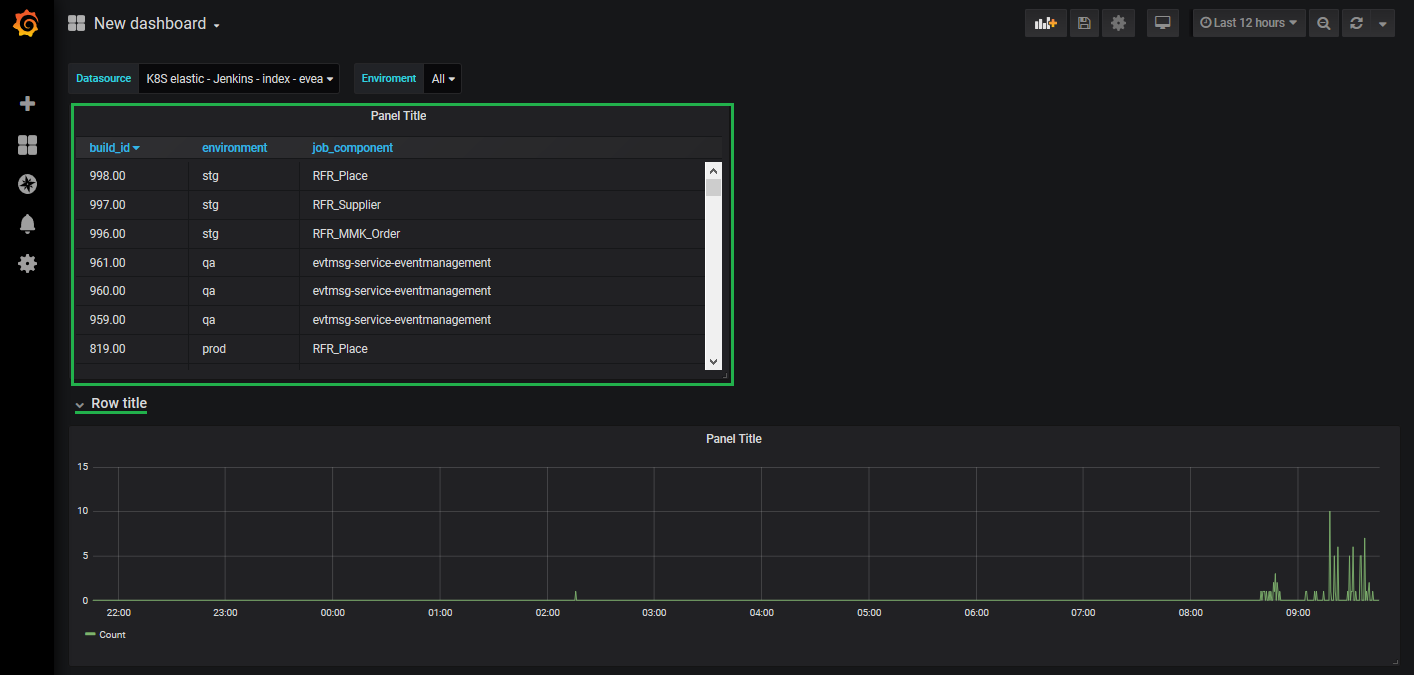
Figure 27: Moving the table
Bon appétit!
That’s it! Just don’t forget to save your new dashboard and it is good to go!
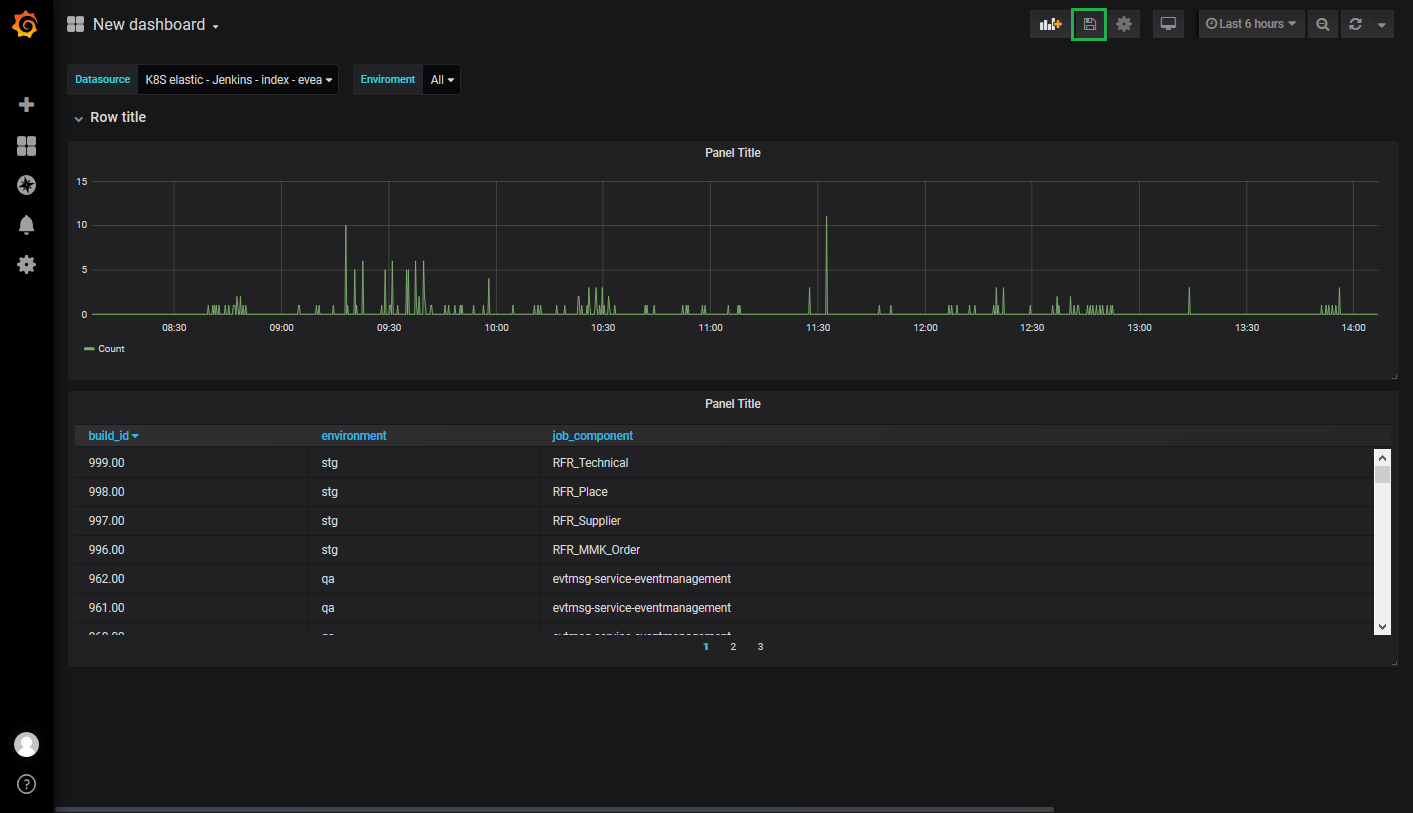
A simple Deployment Dashboard to keep track of the system changes that are happening right now!