What is Node Exporter
It’s an open-source Prometheus exporter which collects and exposes hardware and OS metrics like CPU, System Load, RAM, Network Traffic, Disk, etc. It acts as a layer between the Prometheus server and the system in which the application is hosted to collect metrics.
Node exporter metrics can then be used for several purposes, like visual dashboarding, real-time monitoring, and/or alerting.
Node Exporter metrics on Grafana
In La Redoute, we use Grafana linked to Prometheus datasource for the visual dashboard of node exporter metrics. To have the node exporter metrics on Grafana, there’s no need to create dashboards from scratch; it’s easy to find some Grafana Templates that everyone can use and adapt.
On La Redoute, we started with two templates.
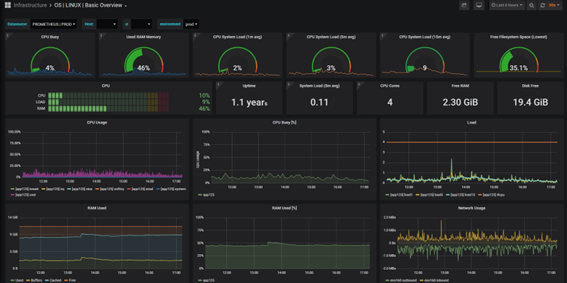
1. A Basic Template that is used to monitor the health and performance of the VMs of our applications which are displayed on our TV screens:
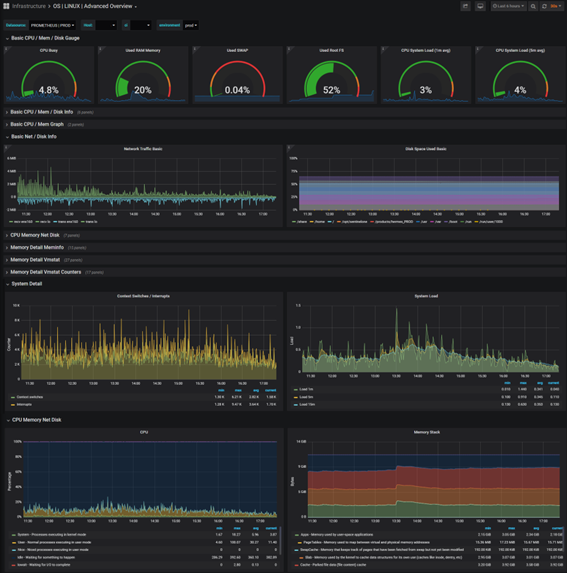
2. An Advanced template to go deeper into the analysis when an issue is raised on the application system performance or health.
Closely monitor our applications
Node Exporter was introduced as one of the monitoring tools for the VMs of our on-premises business applications.
In the past, there was a specific event in which we realized that, if we were monitoring node exporter metrics, the issue could have been prevented and business impacts mitigated.
Node exporter metrics give patterns over time that allow us to determine if something is not going well in the system. If the metric diverges from the pattern, it is a signal that system health is decreasing, which with real-time alerting, gives us time to analyze, find and fix the issue, even before any business impact is felt, like performance degradation or outages.
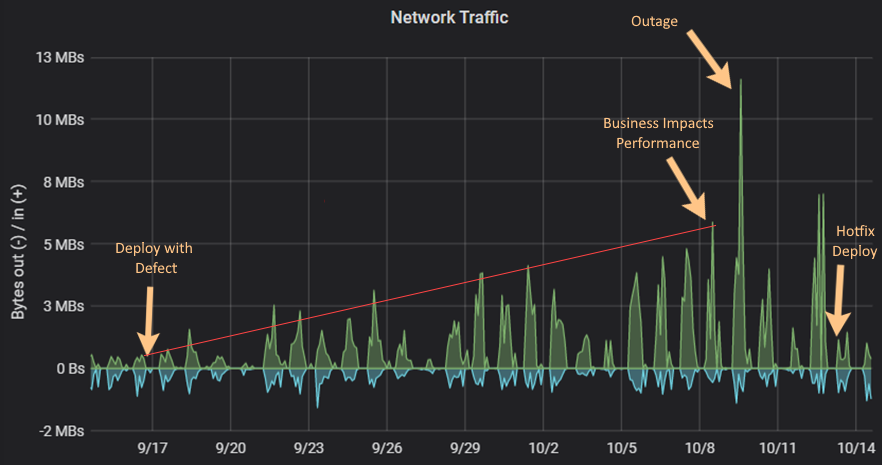
Figure 4 represents the behavior of the metrics Network Traffic (node_network_receive_bytes_total, node_network_transmit_bytes_total) from the deployment where a defect was introduced on 17/09 until its resolution on 13/10. This defect was not noticed until the business started to complain about performance issues almost 3 weeks later. The defect was adding input traffic in the system and slowly consuming all the system resources, time that the business felt the impact, and later an outage, which forced infra teams to add more resources to the VM, until the issue was fixed.
Also, the System Load was affected by the defect. In Figure 5 it’s clear we have a slow increase of the System Load (node_loadn) over the time since the deployment until the hotfix, which was not properly monitored and, in the end, led to business impact.
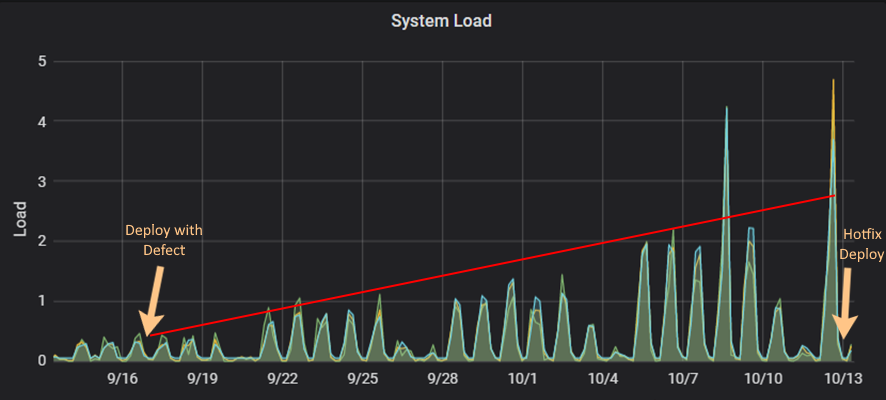
After a proper debriefing of what could have been done to prevent/mitigate the business impacts, it was clearly visible that since the defect until the business felt the impact, the Network Traffic and the System Load metrics were unstable and increasing slowly (represented in red on both images).
This outage led us to define which most important metrics are exposed by node exporter for this specific system, find the patterns, monitor them, and finally implement proper alerts in real-time in case instability is detected in one metric value.
As a first step for monitoring and alerting, we defined two simple metrics as the ones which we consider the most valuable for this specific case.
- System Load – CPU measurement for a given moment. Represents the number of processes that are being executed or waiting to be executed.
- Network Traffic – Helps to calculate network bandwidth, having the bytes either transmitted or received across the system.
By implementing alerting for these two metrics, we successfully reduced the critical impact events to almost zero.
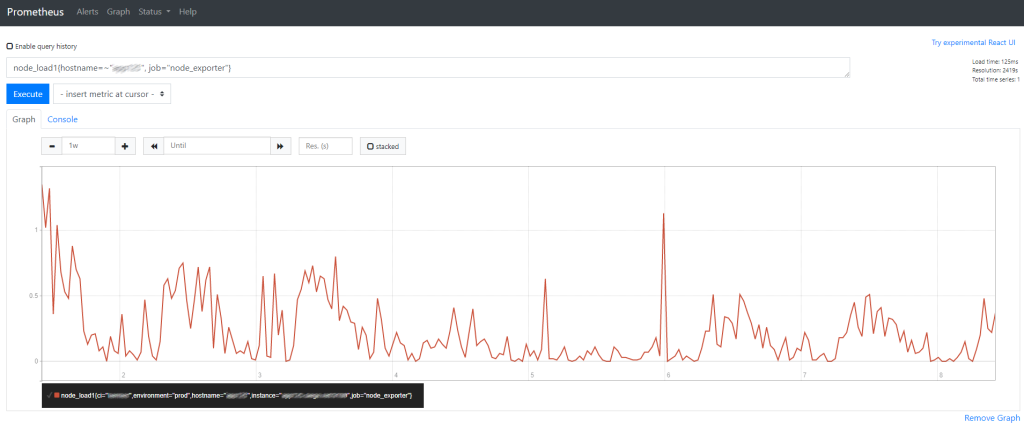
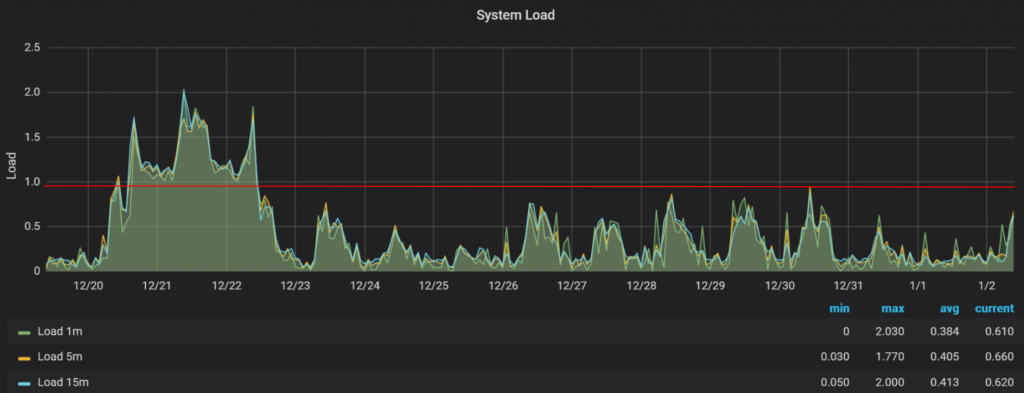
The next image represents an example of the system load values exposed by the node exporter, where it’s visible that on 20/12 an event happened that was impacting the system. As an automated alert was raised, the support teams were able to quickly understand what happened and fix it, even before the values of the system load increases until the point that impacts business applications.
As a conclusion, node exporter has become an essential tool in La Redoute’s portfolio for monitoring and alerting. Since its implementation, it has helped to monitor the performance and health of our legacy systems. The tool has enabled the engineering and support teams to track deployments, maintenance, and unplanned events and avoid or mitigate unexpected issues that were not getting attention. Node exporter allows our teams to act proactively towards potential issues, and when not possible to solve them before they happen, it also allows to quickly react and search for a diagnostic and consequently to act rapidly on their resolution.