
The Four Golden Signals
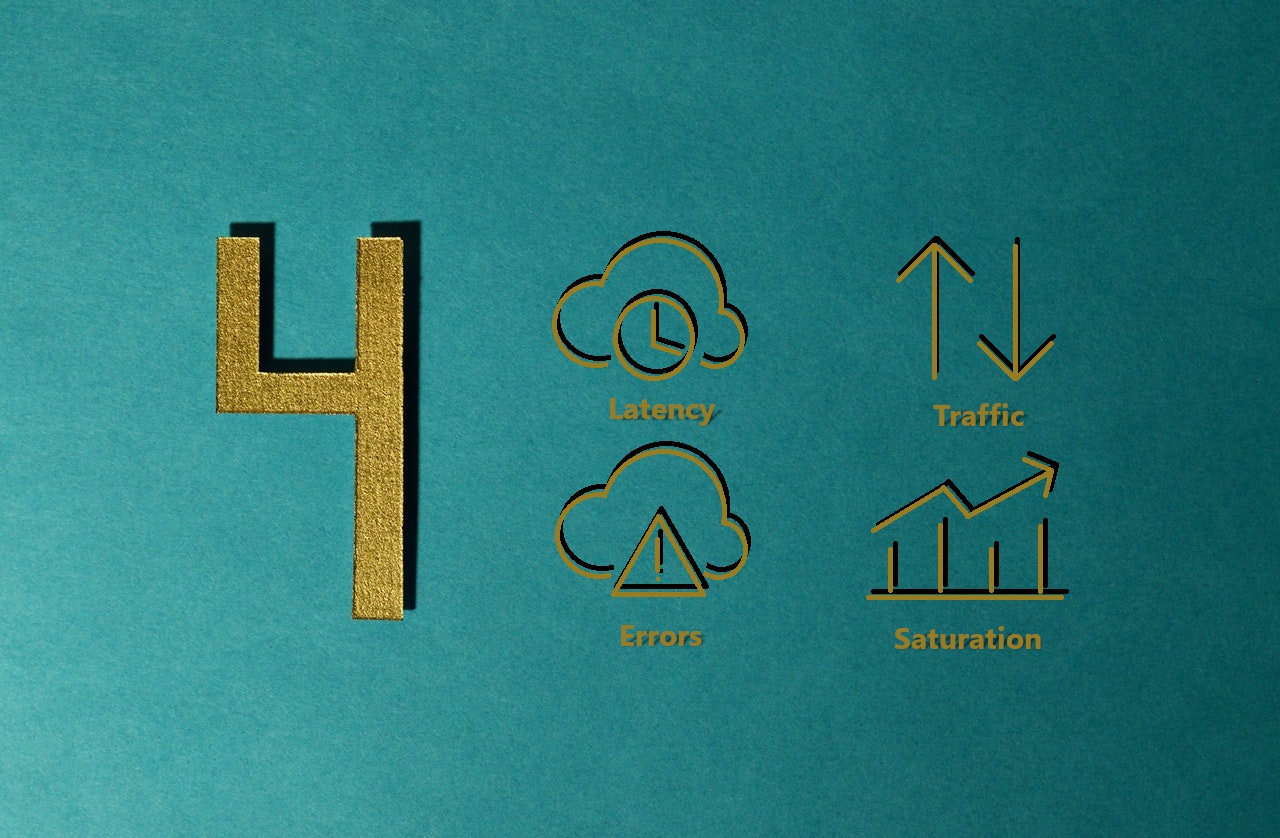
The four golden signals of SRE and monitoring were introduced in the Google SRE book.
Latency
With the latency signal, we want to measure the time, in ms, it takes to service a request. The requests ending in error can affect the overall response time, so we need to take that into consideration. Instead of just filtering out the errors, we want to track their response time as well.
Traffic
For the traffic signal, we want to measure the demand our system is being put through. Therefore, we need to know how many HTTP requests, events consumed or produced our services are handling per second.
Errors
With the third signal, we want to measure the % of errors our services are returning. In this case, we consider the HTTP 5xx responses. Additionally, and linked with latency, we also observe if the services response time is over half a second. We validate that the response content is the right one in our end to end testing.
Saturation
In this fourth signal, we want to measure the resources spent by our services. This way, we are able to take action before the system starts to degrade in performance. We currently focus on the CPU and memory % usage for our services and observe the lag specifically for Kafka consumers.
How can we put our metrics to use?

We have all of our metrics gathered by Prometheus and use Thanos as our long term storage. In other words, we have all the metrics at our disposal in one place. Due to the miriad of metrics we have at hand, we have opted to split our dashboards in 3 levels.
A Simplified Overview
We have applied the four golden signals of SRE and monitoring to this type of dashboard. On top of that, we added metrics to allow us to check the service status and overall health in a glance.
A Technical Overview
In this type of dashboards, we included the remaining metrics. We re-evaluate the usage of these metrics from time to time or when there is an incident. For example, we may observe that a metric helped us to quickly detect a problem. In this situation, we can promote it to the simplified overview level.
A Business Overview
To complement the first two levels of dashboards, where we can observe each component individually, we have defined a third one. This last overview aims to represent the business process. It means that we create dashboards per business process with the flow between the different components that are a part of it.
We have our metrics dashboards and now what?
We can use these dashboards to observe the system and act preemtively or to tackle an incident. The simplified and business overview can be used for both cases, while the technical overview is more of a complement for incident analysis.
When an alert is raised and the only thing we know is that it’s affecting a business process, we can start by identifying the component in the business overview dashboard. Once we know the component name, we can check the simplified overview dashboard, and technical overview, for more information. The metrics we observe may not tell us the exact cause but will point us in the right direction.
In the next articles we’ll go through the simplified and business overview dashboards in more detail.