From mixed data sources to Process Mining analysis
The data from processes is available in a panoply of IT systems, as typical as relational databases, CSV files, spreadsheets, transactional and message logs, or ERP systems (e.g., SAP or Oracle). Even our emails can be used as a source for process analysis, providing we are able to extract the data in a format that can be analysed. Sources of data can be structured or unstructured, and that data may be dispersed over multiple platforms and organizational structures.
As drivers of digital transformation, “APIzation” strategies are also providing new ways for companies to expose their data and processes. From here, new capabilities arise that allow to leverage Open APIs to access different platforms, including social media.
An important step before starting a process mining analysis is to get the data in a compliant format. Therefore, additionally to all steps required to collect and cleaning data – transverse to all data science disciplines – it is necessary to ensure that certain attributes are present in the dataset. The application of PM techniques relies on the core concept of Event Log.
So, what is an Event Log?
As seen in the previous article Process Mining 101: Why should we care?, the event log is a common input for the three types of techniques: process discovery, conformance checking and process enhancement. If you are applying the last two techniques, then your reference model will also be an input for the algorithm, either for deviation analysis or for model improvement.
An event log contains data from a process, and each event in that log corresponds to a single process instance, known as a case or trace. A case is a collection of events, and an event encompasses attributes that describe what happened in the process. Figure 1 provides a simple view of the structure for an event log. For example, if we pick the order treatment example, the attributes may include the order date, the article identifier, the order amount, customer’s address, among others.

What are the attributes required in a case?
The group of attributes used by PM techniques may differ, since different perspectives can be adopted: control-flow, organizational, time-based, or costs-based. Nonetheless, there are certain attributes that are mandatory. It is important to mention that the identification of the attributes in a dataset — mandatory or not — should be based on the context. Thus, before selecting the attributes to analyse, one should ask himself/herself: what are the questions I want to see addressed?
The <case id> is the first mandatory attribute, since it represents the unique identifier for the object being “processed”, e.g., in an order treatment scenario, the order number can be the case id. The word can was highlighted since different approaches can be followed to analyse the event log, leading to the selection of other possible case ids that represent different views of the process.
The <case id> in combination with the <activity> constitute the minimum set of attributes for PM analysis. The usage of only these two fields requires that the events inside the dataset are ordered, otherwise we will not have the accurate view for the sequence of events. Therefore, if available, we should consider the <timestamp> as a third required attribute since it will allow us to have better visibility about the sequence of events.
Is there a standard format to describe an Event Log?
Yes, the XES standard. The PM community has been working on the advancement of the discipline, and an output of this work is the XES — eXtensible Event Stream — which was established as the de facto standard for storing event logs by the IEEE task force. It was preceded by the format Mining eXtensible Markup Language (MXML). You can find more details about the XES specification on www.xes-standard.org. Tools such as ProM use this standard and provide mechanisms to convert data from traditional formats, such as CSV, into XES.
How do we start? With the tool, the ProM toolkit.
Now that we have presented you with a few theoretical concepts, it is time to see things by yourselves! The first step is to get the tool.
There are several vendor solutions, but for our experiments we are using an open source tool – ProM; it is widely used by the community and it provides access to a great number of algorithms, some of them neither available nor implemented by the commercial tools.
Go to http://www.promtools.org/, and then download the latest version (at this date, the Prom 6.10) that fits your system. After downloading it, you will have access to two tools: ProM Toolkit — core application, and ProM Toolkit Package Manager – the application for plugins management.
Use case: Event log for the lifecycle of a bug tracking system
You now have the tool, but you still need an event log. For sake of simplicity, the extraction, data cleaning and transformation steps were already done, and we will focus on the importation and visualisation of an event log.
The data presented in this article was extracted from the Mantis platform, an open source issue tracker used by La Redoute’s teams. In future work we will analyse data from Jira and Gitlab, since we are migrating to these tools. The Mantis platform relies on a MySQL database that registers the tickets, also known as mantis, and their lifecycle. Other data about the projects and users is also available. From the database, we extracted a CSV file which is available here. This file is a snapshot of a certain period, and therefore it may contain process instances that did not reach the “end” status.
In Mantis Platform, it is possible to observe what is the default mantis lifecycle for a new project. In our scope, it translates to the diagram displayed in Figure 2. You can find the definition for each status here.

Import a dataset: quick steps to load and visualize your CSV dataset
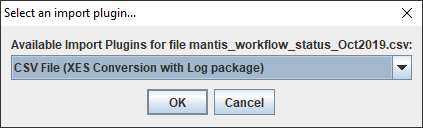
1. Open ProM tool and visualize your workspace (first tab displayed). To import a CSV file dataset, you should click on “import…”, the button on the top-right corner, as displayed in Figure 3.

2. ProM will ask you to choose the import plugin; for this article, we will not analyse the types of plugins available, but instead we will select the “CSV File (XES Conversion with Log package)” without questioning 😊.
3. After importing the CSV file, you will notice that a new entry was added in the workspace (highlighted in green). Each entry listed is a resource that you have on your ProM’s workspace, and you can apply different actions on it using the set of buttons displayed in the right pane (star, eye, play, and a cross).

4. If we select the “eye”, we can visualize the content of the CSV file.

XES conversion: convert the CSV file into the standard format XES
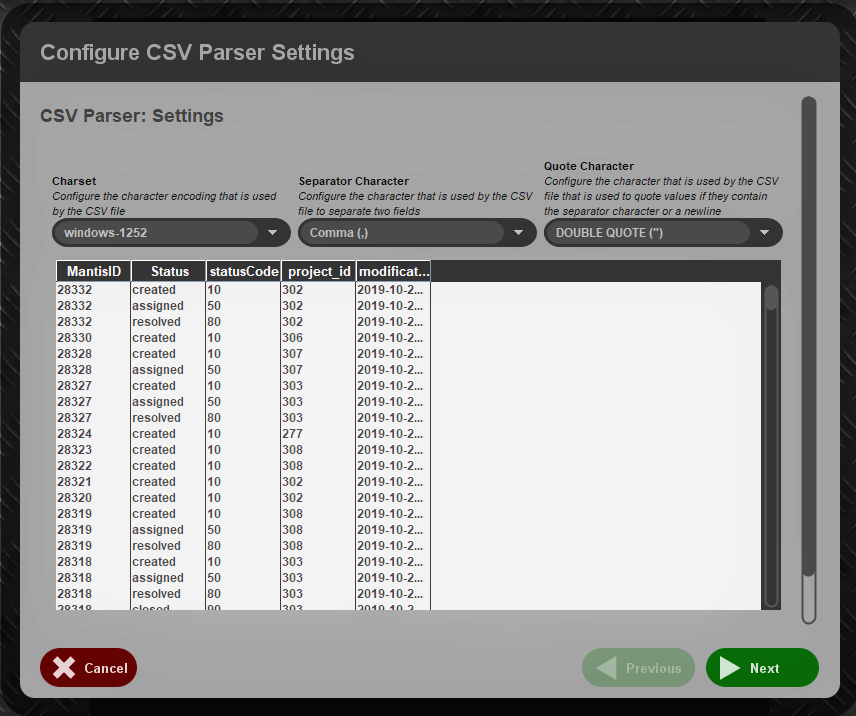
1. In the workspace, if we select the “play”, we can convert our CSV file in the XES file. We will select the first plugin “Convert CSV to XES”, and then click “Start”.

2. When we start, we are presented with some parsing options. For our dataset, we can keep the default values.
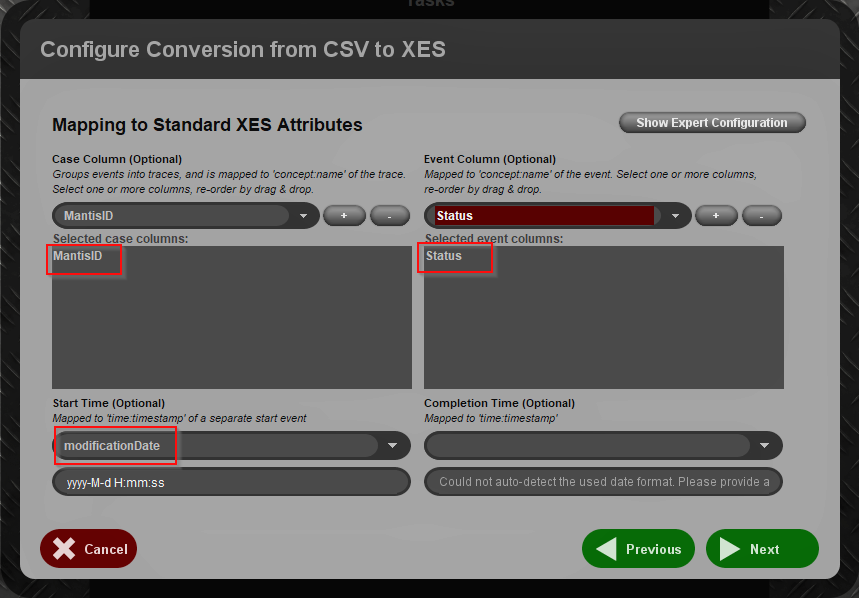
3. Next step is to select the mandatory attributes that represent the perspective we want to analyse. The MantisID column is the <case id>, the Status column is the <activity> attribute, which represents the event that happened to that mantis, and finally we are able to specify a <timestamp>, the modificationDate column, which is the date when the status of the mantis changed.
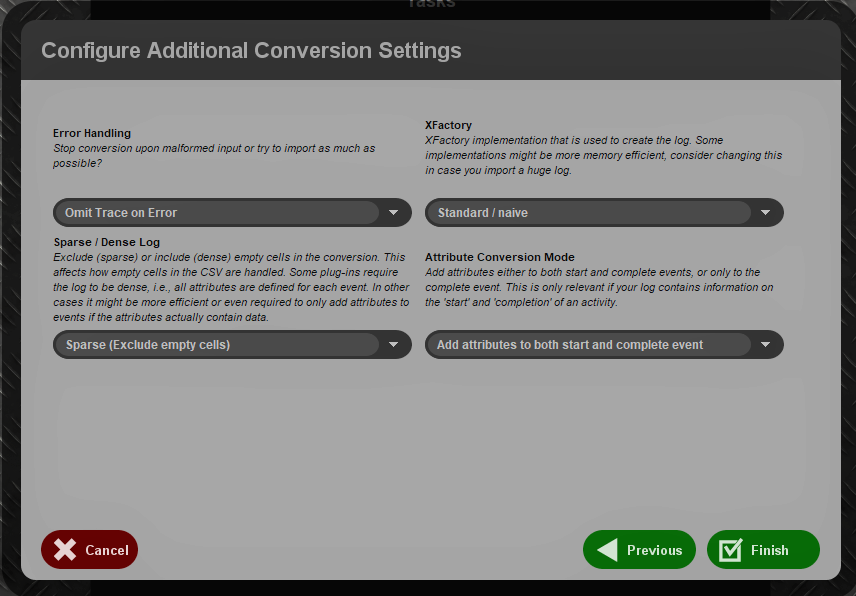
4. In screen “Configure Additional Conversion Settings”, we will keep the default values, and we proceed by clicking “Finish” (Figure 10).
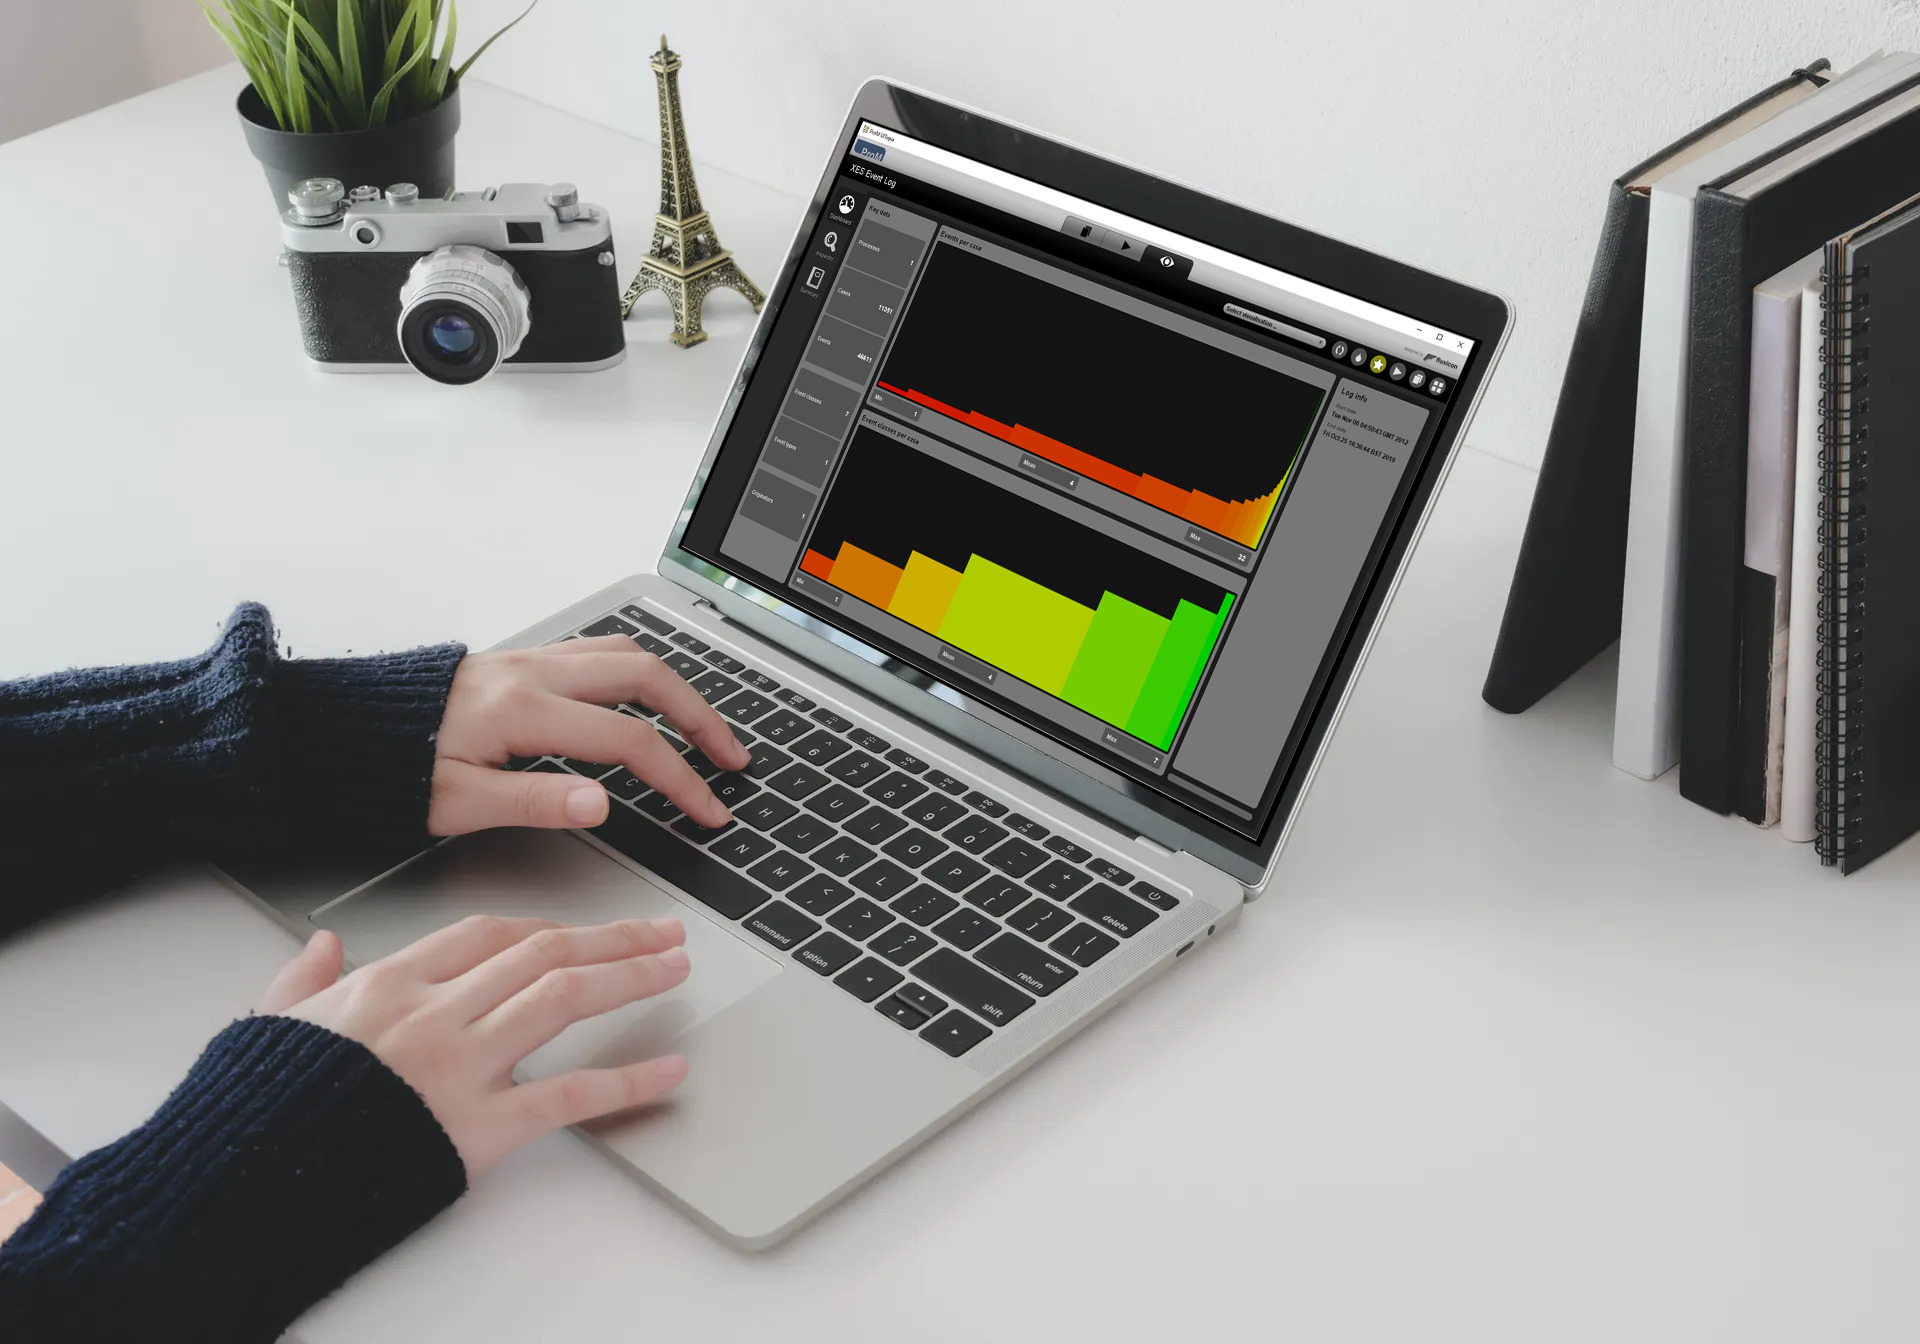
5. After finishing the conversion, you will see the visualisation screen, which contains three main options (in the left): Dashboard, Inspector and Summary. Figure 11 shows the “Dashboard” screen that provides statistics about the dataset.

Note: On the top of the page, in the component “select visualisation …” you choose other ways to visualise your dataset. We let you play with the options, and we will return to this on future articles.
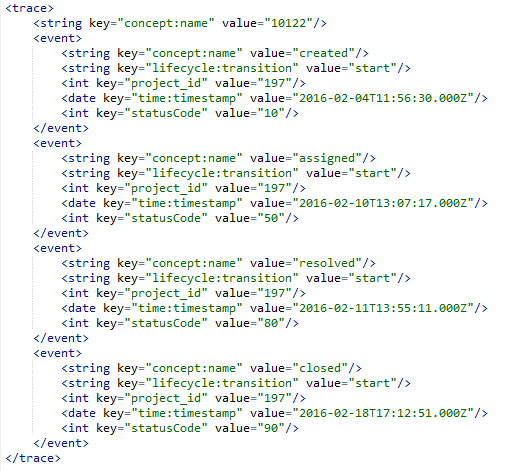
6. If you want to check some examples of the process instances, click on option “Inspector”, as displayed in Figure 12. Randomly picking a process instance, we have 4 events for mantis 10122.

7. Picking another process instance as an example, the mantis 6516 in Figure 13, we can see that there is a status “acknowledge” that was not defined in the default configurations. If we look at the ID number and the dates of the events (2014), we can conclude either that at that time there was another status configured in the default lifecycle (Figure 2), or that the project in question defined a specific custom status.

8. As a final step for this quick how to article, we will export our dataset to a XES file, as seen in Figure 14. For that purpose, go back to workspace screen (1st tab on the top), then click on the entry with name “XES Event Log”, and then click on “Export to disk”.

After exporting the dataset to disk, you can open it with your preferred text editor. If you search for mantis 10122, you will find an XML element describing the events that took place for that mantis (Figure 15).
How does this help us? You may ask.
As a first thought, we would say “it is a user-friendly way of seeing our process dataset”. Additionally, it provides statistics and ways of inspecting the events that compose our process instances. Finally, and we will talk about it on future articles, we can apply PM algorithms to our datasets and discover and/or validate what is happening on the reality.
Conclusion
The goal of this article was to introduce you to a dataset representative of process instances, in this case the issue lifecycle for a bug tracking system. With help of ProM, we were able to access some statistics and inspect the events stored in our dataset. In the tool’s official page, you can find other tutorials that detail the features available. In the next articles we will continue to explore PM capabilities via the ProM tool. And we will keep presenting you other use cases of interest inside La Redoute.