
Data is at the heart of digital companies fuelling a continuous flow of information. Some actors are even more focused on collecting data before creating products, like Google. Their offers are relying on a capacity to store and process a massive scale of data.
The digital world continues to produce even more data over time, from a variety of sources, devices, and locations. The adoption of data science in day-to-day operations is a factor increasing the criticality of data systems and the data they process.
A set of products are emerging on the market, but major actors have already started their own initiatives like Airbnb, Netflix or Uber. This article is one example of a data quality initiative led by major companies.
More data comes with its set of challenges.
Why caring about Data Quality?
The increasing scope of data inevitably leads to an increased probability of data issues. Data engineering techniques historically handled via ETL patterns already incorporated some control mechanisms. The changes lie in the variety, scale, complexity and speed that organisations need to process data, known as the major “V” of Big Data.
New architectures of ET* and ELT with real-time capabilities are part of the solution, at the same time increasing the pressure on data quality. More is at stake when working with insights, i.e., when we act based on the data.
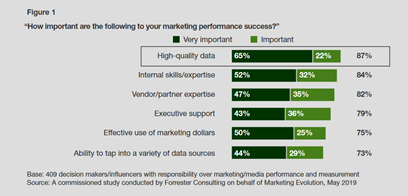
Insights create their value when organizations make decisions and drive changes; but what happens with insights generated from partially validated data? The decision-making process will decrease in quality and impact, in the end, the company performance. Factually, 82% of marketing leaders or survey organizations are making data quality improvements a “top” or “high” priority, being the No.1 factor, over their team expertise[1]. The first approach taken is usually reactive.
A reactive data quality approach is already a first step but not enough. Organizations are expanding their data source due to the complex digital interactions and datasets available; but first-party, second-party and third-party data have a decreasing level of quality namely 61%, 26% and 17%. Those numbers are not a decimal in the portion of data used for insights; an even important criterion when deploying decision-making at scale based on those data: Data science.
A machine learning model can generate an impactful wrong output due to poor data quality. Starting with product recommendation, the risk is acceptable even if opportunity cost can still be huge depending on the scale of the company. But, when deploying data science for business-critical systems – like health services – there is low room for errors.
Data quality is therefore a true challenge for organizations relying more and more on data to drive their insights, decision-making and change. Quality being valuable to someone; in today’s organizations, the various personas and their use-cases must be considered. Data is also about the trust people can have in the algorithms, the whom is therefore important.
What are we trying to solve, for whom?
Data quality can be applied to the entire data pipeline, starting from the engineering up to the reporting and data science layers. Key actors emerged to fulfil different use-cases from marketing analysts, business analysts, up to the data engineers.
Traditional data quality was mainly the work of IT securing the batch processing with basic rules of data validation formats. We saw that the data evolution context created the need to handle the challenges of the Big Data paradigms. Cloud platforms have been solving the scalability issues while starting to provide some tooling. Google Dataprep is an example providing data recommendation, anomalies and patterns recognition. Why it’s not enough?
Data depends on context. The context is business. Business requires contextualized data quality.
A manual approach of back-and-forth definition between business and engineering teams does not scale. It is prone to slow, degraded and unreactive data quality rules. Our goal is to speed up improved decision-making while limiting our time on engineering and supporting activities. This requirement is an ecosystem trend explaining the emergence of platforms. Self-service for the personas is a key element of platforms, supported by a product.
For these reasons, we decided to approach data quality as a product.
Start by the business personas and business problems
The first step in building a product is defining the personas and the major use-cases that we want to address. Once again, the key focus of our product is the business users, so that is where our persona definition should start. From the perspective of a data team, we have several kinds of business users.
First, we have our business data key users – people who are familiar with data perspectives, maybe know how to build simple queries and dashboards. What we found was that these people are quite aware of the importance of data quality. They work at building indicators and safe checks about the quality of the data they are using in their business analysis. For this population, the goal of our tool is to allow them to develop these indicators about data quality in a fast, reliable, and repeatable way.
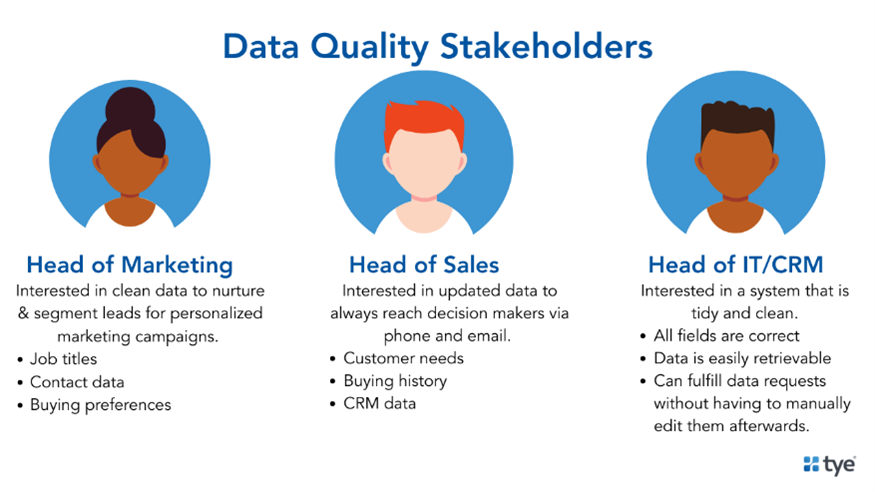
We also have business users who are less tech-savvy but use reports and hold some of the business knowledge required to assess the quality of data. Here the challenge is quite different for our product, as it should offer a simple experience to the user allowing him/her to verify the data in use: get an idea of how this quality is measured, and maybe tweak some parameters or define simple sanity-checks regarding business processes.
Include the engineering and technology perspective afterwards
Finally, as data engineers we wanted to be able to manage this data quality platform, to keep up with the business needs as usage grew.
When building a product, we tend to start small, while keeping in mind the necessity of scaling. To do so, we started by defining a few quite simple and common use cases of data quality tests. They included rules on completeness based on volumes, correctness based on patterns and limits, and accuracy based on distributions and comparison with a referential.
While these types of tests are quite simple and could be manually built in an ad-hoc fashion, they are time-consuming. They require back and forth with business users for any pipeline we are building. The aim was to use these tests as the basis for building a data quality framework, which would scale both in terms of pipeline coverage and richness of functionality.
Once the concept was validated, we started building manually a few of these tests, and built a PoC by creating the first iteration of our test type library, by making these tests parametrized and more generic. While these first results were satisfying for us as Data Engineers – setting up tests was quite easy, we just needed to edit configuration files and deploy tests – it needed a crucial component to make the product usable by its target audience: a user interface.
The results of our first iterations
The approach we chose to build our product was a feature team mindset. Business and experts were involved to ensure that we iterated quickly and in a good direction. Data and IT teams built together the application to reach an MVP of the product.
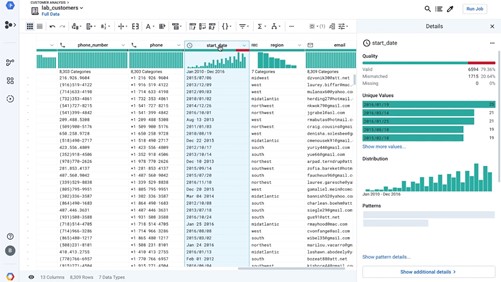
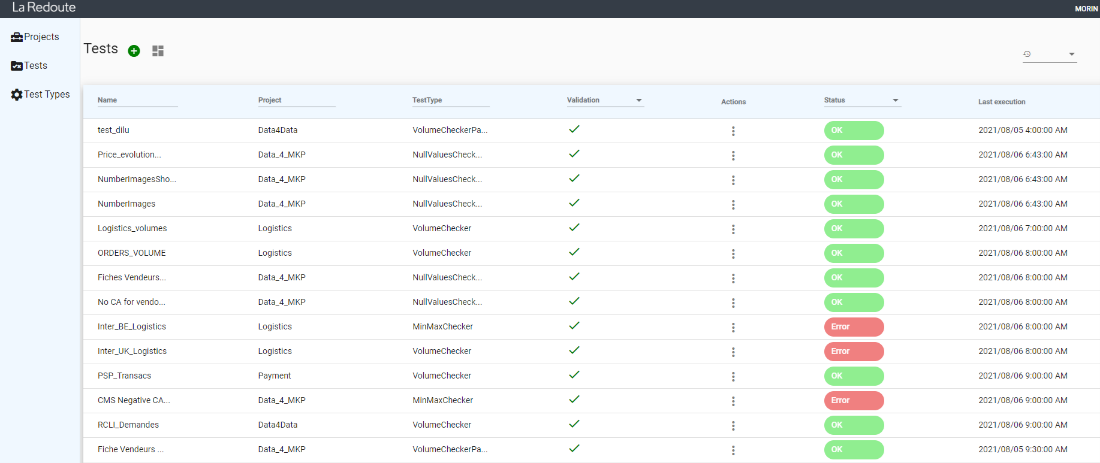
The first product was an interface allowing business users to create, see and manage collections of tests, relying on the test type library that we started to build in the PoC. Another key feature was the possibility for the Data Team to manage our test type library from the application, allowing us to quickly add and improve test types, to expand more easily.
With that MVP, we onboarded members of the business teams to start beta-testing the application, by having them create tests, give us feedback about the features and the different test types. As planned, we were able to quickly create test types that fitted their usage, eventually helping us to save time developing ad-hoc tests in response to incidents.
Because a monitoring system is only as good as what reaches the ears of the end-user, we developed alerting and dashboarding features. It enabled to provide a faster reactivity while adding as much information as available to the user and the data team. This is still a work in progress, and we look forward to improving these features based on the suggestions of our users
Our learnings, perspective, and future developments
While this project is still very much alive, we are already able to draw some learnings from the project. One of the key aspects of the success of such tech for business projects is the ability of members of different teams to collaborate towards a common goal. A common pitfall that we had to avoid was people deep-diving into technical rabbit holes related to their area of expertise, without necessarily creating business value.
Collaborating in an iterative, step-by-step approach also allowed us to quickly refine our vision and developments, based on the feedback and KPIs that are collected, in a much more agile fashion than it would be in a waterfall development model.
Finally, we aimed at simplifying the data quality monitoring for our business teams, starting small and not wasting time in pre-optimization which lead to a better experience for them, by focusing the developments on the features that matter the most.
We are currently launching the product at scale at La Redoute and expect to be able to build better and smarter features, with more complex test types and richer analytical capabilities. Stay tuned for future news about its development.
References
Forrester Report, Why Marketers Can’t Ignore Data Quality: https://cdn2.hubspot.net/hubfs/1878504/Forrester%20TLP-2019/Forrester%20Report%20Why%20Marketers%20Cant%20Ignore%20Data%20Quality.pdf
Ref Persona: Putting Personas to Work in UX Design: What They Are and Why They’re Important
https://xd.adobe.com/ideas/process/user-research/putting-personas-to-work-in-ux-design/